Pentax 2005 Annual Report Download - page 10
Download and view the complete annual report
Please find page 10 of the 2005 Pentax annual report below. You can navigate through the pages in the report by either clicking on the pages listed below, or by using the keyword search tool below to find specific information within the annual report.-
 1
1 -
 2
2 -
 3
3 -
 4
4 -
 5
5 -
 6
6 -
 7
7 -
 8
8 -
 9
9 -
 10
10 -
 11
11 -
 12
12 -
 13
13 -
 14
14 -
 15
15 -
 16
16 -
 17
17 -
 18
18 -
 19
19 -
 20
20 -
 21
21 -
22
-
23
-
24
-
25
-
26
-
27
-
28
-
29
-
30
-
31
-
32
-
33
-
34
-
35
-
36
-
37
-
38
-
39
-
40
-
41
-
42
-
43
-
44
-
45
-
46
-
47
-
48
-
49
-
50
-
51
-
52
-
53
-
54
-
55
-
56
-
57
-
58
-
59
-
60
-
61
-
62
-
63
-
64
-
65
-
66
-
67
-
68
-
69
-
70
-
71
-
72
-
73
-
74
-
75
-
76
-
77
-
78
-
79
 |
 |

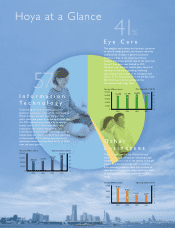
Hoya at a Glance
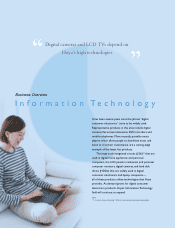
Information
Technology
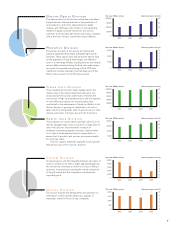
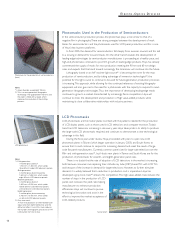
Outstanding demand for digital consumer
electronics products continues to contribute to
Hoya’s business growth. Over the past four
years, sales have grown at an average annual rate
of 11.2%, and operating income by an average
annual rate of 20.0%. Both sales and profits
continue to see double-digit growth. The
contribution of Information Technology sales to
overall sales has risen from 46.2% four years ago
to the current 57.2%, and the contribution to
operating income has risen from 62.2% to 75.6%
over the same period.
57%
2002200320042005
200,000
150,000
100,000
50,000
0
Net sales (Millions of yen)
50
40
30
20
10
0
Operating income ratio (%)
108,653 116,946 139,187
176,413
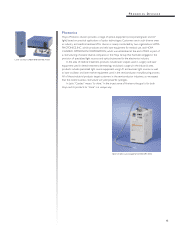
Eye Care
The eyeglass and contact lens business continues
to record steady growth, and remains relatively
unaffected by changes in general economic
conditions. Due to the maturity of these
markets, the annual growth rate of net sales over
the past four years was limited to 4.5%.
However, over the past several years, Hoya has
worked to improve profitability, achieving
operating income growth at an average annual
rate of 17.5%. Hoya’s goal is to see the Eye Care
field continue to expand alongside the
Information Technology field.
41%
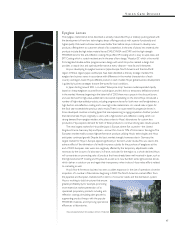
Other
Businesses
The four-year trend in the Crystal division
shows continued contraction, reflecting tough
market conditions such as the decline of the gift
market and the increasingly stiff competition
from overseas products. Hoya will continue to
scale back on its product range, pursuing a scale
of business that is a good match for market
needs.
12,000
8,000
4,000
0
Net sales (Millions of yen)
10,322
8,242
5,673 5,379
6
5
4
3
2
1
0
Operating income ratio (%)
2002200320042005
150,000
120,000
90,000
60,000
30,000
0
Net sales (Millions of yen)
116,290 121,105 126,584 126,380 25
20
15
10
5
0
Operating income ratio (%)
2002200320042005