OfficeMax 2011 Annual Report Download - page 61
Download and view the complete annual report
Please find page 61 of the 2011 OfficeMax annual report below. You can navigate through the pages in the report by either clicking on the pages listed below, or by using the keyword search tool below to find specific information within the annual report.-
 1
1 -
2
-
3
-
4
-
5
-
6
-
7
-
8
-
9
-
10
-
11
-
12
-
13
-
14
-
15
-
16
-
17
-
18
-
19
-
20
-
21
-
22
-
23
-
24
-
25
-
26
-
27
-
28
-
29
-
30
-
31
-
32
-
33
-
34
-
35
-
36
-
37
-
38
-
39
-
40
-
41
-
42
-
43
-
44
-
45
-
46
-
47
-
48
-
49
-
50
-
 51
51 -
 52
52 -
 53
53 -
 54
54 -
 55
55 -
 56
56 -
 57
57 -
 58
58 -
 59
59 -
 60
60 -
 61
61 -
 62
62 -
 63
63 -
 64
64 -
 65
65 -
 66
66 -
 67
67 -
 68
68 -
 69
69 -
 70
70 -
 71
71 -
72
-
73
-
74
-
75
-
76
-
77
-
78
-
79
-
80
-
81
-
82
-
83
-
84
-
85
-
86
-
87
-
88
-
89
-
90
-
91
-
92
-
93
-
94
-
95
-
96
-
97
-
98
-
99
-
100
-
101
-
102
-
103
-
104
-
105
-
106
-
107
-
108
-
109
-
110
-
111
-
112
-
113
-
114
-
115
-
116
-
117
-
118
-
119
-
120
-
121
-
122
-
123
-
124
-
125
-
126
-
127
-
128
-
129
-
130
-
131
-
132
-
133
-
134
-
135
-
136
 |
 |

We sponsor noncontributory defined benefit pension plans covering certain terminated employees, vested
employees, retirees, and some active employees, primarily in Contract. Pension expense was $10.9 million,
$7.3 million and $14.1 million for the years ended December 31, 2011, December 25, 2010 and December 26,
2009, respectively. In 2011, 2010 and 2009, we made cash contributions to our pension plans totaling
$3.3 million, $3.4 million and $6.8 million, respectively. In 2009, we also contributed 8.3 million shares of
OfficeMax common stock to our qualified pension plans. The estimated minimum required funding contribution
in 2012 is $28.5 million and the expense is projected to be $3.3 million compared to expense of $10.9 million in
2011. In addition, we may elect to make additional voluntary contributions. See “Critical Accounting Estimates”
in this Management’s Discussion and Analysis of Financial Condition and Results of Operations for more
information.
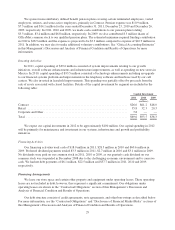
Investing Activities
In 2011, capital spending of $69.6 million consisted of system improvements relating to our growth
initiatives, overall software enhancements and infrastructure improvements, as well as spending on new stores in
Mexico. In 2010, capital spending of $93.5 million consisted of technology enhancements including an upgrade
to our financial systems platform and improvements in the telephony software and hardware used by our call
centers. We also invested in leasehold improvements. This spending was partially offset by proceeds from the
sale of assets associated with closed facilities. Details of the capital investment by segment are included in the
following table:
Capital Investment
2011 2010 2009
(millions)
Contract ................................................................ $26.0 $61.2 $18.0
Retail .................................................................. 35.8 32.3 20.3
Corporate and Other ....................................................... 7.8 — —
Total ................................................................... $69.6 $93.5 $38.3
We expect our capital investments in 2012 to be approximately $100 million. Our capital spending in 2012
will be primarily for maintenance and investment in our systems, infrastructure and growth and profitability
initiatives.
Financing Activities
Our financing activities used cash of $18.0 million in 2011, $28.5 million in 2010 and $60.6 million in
2009. Preferred dividend payments totaled $3.3 million in 2011, $2.7 million in 2010 and $3.1 million in 2009.
No dividends were paid on our common stock in 2011, 2010 or 2009, as our quarterly cash dividend on our
common stock was suspended in December 2008 due to the challenging economic environment and to conserve
cash. We had net debt payments of $6.1 million, $22.5 million and $57.7 million in 2011, 2010 and 2009,
respectively.
Financing Arrangements
We lease our store space and certain other property and equipment under operating leases. These operating
leases are not included in debt; however, they represent a significant commitment. Our obligations under
operating leases are shown in the “Contractual Obligations” section of this Management’s Discussion and
Analysis of Financial Condition and Results of Operations.
Our debt structure consists of credit agreements, note agreements, and other borrowings as described below.
For more information, see the “Contractual Obligations” and “Disclosures of Financial Market Risks” sections of
this Management’s Discussion and Analysis of Financial Condition and Results of Operations.
29