OfficeMax 2011 Annual Report Download - page 58
Download and view the complete annual report
Please find page 58 of the 2011 OfficeMax annual report below. You can navigate through the pages in the report by either clicking on the pages listed below, or by using the keyword search tool below to find specific information within the annual report.-
 1
1 -
2
-
3
-
4
-
5
-
6
-
7
-
8
-
9
-
10
-
11
-
12
-
13
-
14
-
15
-
16
-
17
-
18
-
19
-
20
-
21
-
22
-
23
-
24
-
25
-
26
-
27
-
28
-
29
-
30
-
31
-
32
-
33
-
34
-
35
-
36
-
37
-
38
-
39
-
40
-
41
-
42
-
43
-
44
-
45
-
46
-
47
-
 48
48 -
 49
49 -
 50
50 -
 51
51 -
 52
52 -
 53
53 -
 54
54 -
 55
55 -
 56
56 -
 57
57 -
 58
58 -
 59
59 -
 60
60 -
 61
61 -
 62
62 -
 63
63 -
 64
64 -
 65
65 -
 66
66 -
 67
67 -
 68
68 -
69
-
70
-
71
-
72
-
73
-
74
-
75
-
76
-
77
-
78
-
79
-
80
-
81
-
82
-
83
-
84
-
85
-
86
-
87
-
88
-
89
-
90
-
91
-
92
-
93
-
94
-
95
-
96
-
97
-
98
-
99
-
100
-
101
-
102
-
103
-
104
-
105
-
106
-
107
-
108
-
109
-
110
-
111
-
112
-
113
-
114
-
115
-
116
-
117
-
118
-
119
-
120
-
121
-
122
-
123
-
124
-
125
-
126
-
127
-
128
-
129
-
130
-
131
-
132
-
133
-
134
-
135
-
136
 |
 |

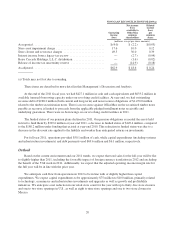
partially offset by higher operating, selling and general and administrative expenses due primarily to increased
spending on our growth and profitability initiatives.
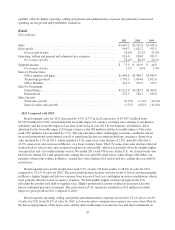
Retail
($ in millions)
2011 2010 2009
Sales ........................................................... $3,497.1 $3,515.8 $3,555.4
Gross profit ...................................................... 999.7 1,022.7 975.2
Gross profit margin ............................................ 28.6% 29.1% 27.4%
Operating, selling and general and administrative expenses ................ 924.4 918.8 930.3
Percentage of sales ............................................ 26.4% 26.1% 26.1%
Segment income .................................................. $ 75.3 $ 103.9 $ 44.9
Percentage of sales ............................................ 2.2% 3.0% 1.3%
Sales by Product Line
Office supplies and paper ....................................... $1,489.8 $1,468.7 $1,446.9
Technology products ........................................... 1,793.3 1,834.6 1,872.6
Office furniture ............................................... 214.0 212.5 235.9
Sales by Geography
United States ................................................. $3,222.4 $3,287.5 $3,369.6
International ................................................. 274.7 228.3 185.8
Sales Growth
Total sales growth ............................................. (0.5)% (1.1)% (10.2)%
Same-location sales growth ...................................... (1.5)% (0.8)% (11.0)%
2011 Compared with 2010
Retail segment sales for 2011 decreased by 0.5% (0.7% in local currencies) to $3,497.1 million from
$3,515.8 million for 2010, and included the favorable impact of currency exchange rates relating to our Mexico
subsidiary and the favorable impact of an extra week in fiscal year 2011 in our domestic subsidiaries. After
adjusting for the favorable impact of foreign currency rates ($8 million) and the favorable impact of the extra
week ($52 million), sales declined by 2.2%. The sales declines reflect challenging economic conditions and an
increased promotional environment as well as significant decline in certain technology categories. Same-store
sales declined by 1.5% in 2011, which included a U.S. same-store sales decline of 2.8%, partially offset by a
14.2% same-store sales increase in Mexico, on a local currency basis. The U.S. same-store sales decline reflected
weaker back-to-school sales and continued weakness in store traffic, which was partially offset by slightly higher
average ticket and a favorable holiday season. We ended 2011 with 978 stores. In the U.S., we closed twenty-two
retail stores during 2011 and opened none, ending the year with 896 retail stores, while Grupo OfficeMax, our
majority-owned joint venture in Mexico, opened five stores during 2011 and closed two, ending the year with 82
retail stores.
Retail segment gross profit margin decreased 0.5% of sales (50 basis points) to 28.6% of sales for 2011
compared to 29.1% of sales for 2010. The gross profit margin declines were the result of lower customer margins
in Mexico, higher freight and delivery expense from increased fuel costs and higher inventory markdowns, which
were partially offset by lower occupancy expenses. We had slightly higher customer margins in the U.S.
reflecting the product-mix shift to supplies sales. Higher promotional activity resulted in increased sales but
placed continued pressure on margins. The extra week in U.S. operations resulted in a $21 million favorable
impact to gross profit in 2011 compared to 2010.
Retail segment operating, selling and general and administrative expenses increased 0.3% of sales to 26.4%
of sales for 2011 from 26.1% of sales for 2010 as lower incentive compensation expense was more than offset by
the deleveraging impact of the lower sales and the unfavorable impact of sales/use tax and legal settlements in
26