OfficeMax 2011 Annual Report Download - page 50
Download and view the complete annual report
Please find page 50 of the 2011 OfficeMax annual report below. You can navigate through the pages in the report by either clicking on the pages listed below, or by using the keyword search tool below to find specific information within the annual report.-
 1
1 -
2
-
3
-
4
-
5
-
6
-
7
-
8
-
9
-
10
-
11
-
12
-
13
-
14
-
15
-
16
-
17
-
18
-
19
-
20
-
21
-
22
-
23
-
24
-
25
-
26
-
27
-
28
-
29
-
30
-
31
-
32
-
33
-
34
-
35
-
36
-
37
-
38
-
39
-
 40
40 -
 41
41 -
 42
42 -
 43
43 -
 44
44 -
 45
45 -
 46
46 -
 47
47 -
 48
48 -
 49
49 -
 50
50 -
 51
51 -
 52
52 -
 53
53 -
 54
54 -
 55
55 -
 56
56 -
 57
57 -
 58
58 -
 59
59 -
 60
60 -
61
-
62
-
63
-
64
-
65
-
66
-
67
-
68
-
69
-
70
-
71
-
72
-
73
-
74
-
75
-
76
-
77
-
78
-
79
-
80
-
81
-
82
-
83
-
84
-
85
-
86
-
87
-
88
-
89
-
90
-
91
-
92
-
93
-
94
-
95
-
96
-
97
-
98
-
99
-
100
-
101
-
102
-
103
-
104
-
105
-
106
-
107
-
108
-
109
-
110
-
111
-
112
-
113
-
114
-
115
-
116
-
117
-
118
-
119
-
120
-
121
-
122
-
123
-
124
-
125
-
126
-
127
-
128
-
129
-
130
-
131
-
132
-
133
-
134
-
135
-
136
 |
 |

ITEM 7. MANAGEMENT’S DISCUSSION AND ANALYSIS OF FINANCIAL
CONDITION AND RESULTS OF OPERATIONS
The following discussion contains statements about our future financial performance. These statements are
only predictions. Our actual results may differ materially from these predictions. In evaluating these statements,
you should review “Item 1A. Risk Factors” of this Form 10-K, including “Cautionary and Forward-Looking
Statements.”
Overall Summary
Sales for 2011 were $7,121.2 million, compared to $7,150.0 million for 2010, a decrease of 0.4%. Sales for
2011 benefitted from favorable foreign currency rate changes ($91 million) and from an extra week in fiscal year
2011 ($86 million) compared to fiscal year 2010. Fiscal year 2011 included 53 weeks for our U.S. businesses,
while fiscal year 2010 included 52 weeks. After adjusting for the favorable foreign currency impact and the
favorable impact of the extra week (“53rd week”), sales declined by 2.9% compared to 2010. Sales and gross
profit margins declined in both our Contract and Retail segments. Consolidated gross profit margin decreased by
0.5% of sales (50 basis points) to 25.4% of sales in 2011 compared to 25.9% of sales in 2010, as lower customer
margins and increased delivery and freight expense were partially offset by lower occupancy expenses. Operating
expenses for 2011 increased compared to the prior year due to the impact of the extra week, the impact of foreign
exchange rates and the impact of favorable settlements in 2010, but were benefitted by lower incentive
compensation expense. We reported operating income of $86.5 million in 2011 compared to $146.5 million in
2010. The 53rd week added $8 million of operating income and $.06 of diluted earnings per share in 2011.
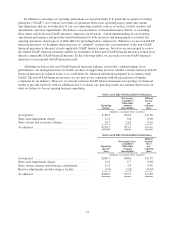
As noted in the discussion and analysis that follows, our operating results were impacted by a number of
significant items in both years. These items included charges for asset impairments, store closures and severance,
partially offset by income related to legacy items. If we eliminate these items, our adjusted operating income for
2011 was $118.2 million compared to an adjusted operating income of $160.6 million for 2010. The reported net
income available to OfficeMax common shareholders was $32.8 million, or $0.38 per diluted share, in 2011
compared to a reported net loss available to OfficeMax common shareholders $68.6 million, or $0.79 per diluted
share, in 2010. If we eliminate the impact of significant items from both years, adjusted net income available to
OfficeMax common shareholders for 2011 was $53.3 million, or $0.61 per diluted share, compared to
$77.3 million, or $0.89 per diluted share, for 2010.
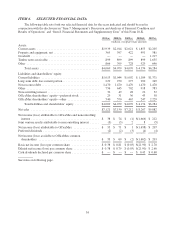
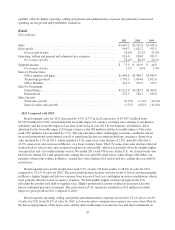
Results of Operations, Consolidated
($ in millions)
2011 2010 2009
Sales ........................................................... $7,121.2 $7,150.0 $7,212.1
Gross profit ...................................................... 1,809.2 1,849.7 1,737.6
Operating, selling and general and administrative expenses ................ 1,691.0 1,689.1 1,674.7
Asset impairments ................................................. 11.2 11.0 17.6
Other operating expenses, net ........................................ 20.5 3.1 49.3
Total operating expenses ............................................ 1,722.7 1,703.2 1,741.6
Operating income (loss) ............................................ $ 86.5 $ 146.5 $ (4.0)
Net income (loss) available to OfficeMax common shareholders ............ $ 32.8 $ 68.6 $ (2.2)
Gross profit margin ................................................ 25.4% 25.9% 24.1%
Operating, selling and general and administrative expenses
Percentage of sales ............................................ 23.7% 23.7% 23.2%
18