OfficeMax 2011 Annual Report Download - page 52
Download and view the complete annual report
Please find page 52 of the 2011 OfficeMax annual report below. You can navigate through the pages in the report by either clicking on the pages listed below, or by using the keyword search tool below to find specific information within the annual report.-
 1
1 -
2
-
3
-
4
-
5
-
6
-
7
-
8
-
9
-
10
-
11
-
12
-
13
-
14
-
15
-
16
-
17
-
18
-
19
-
20
-
21
-
22
-
23
-
24
-
25
-
26
-
27
-
28
-
29
-
30
-
31
-
32
-
33
-
34
-
35
-
36
-
37
-
38
-
39
-
40
-
41
-
 42
42 -
 43
43 -
 44
44 -
 45
45 -
 46
46 -
 47
47 -
 48
48 -
 49
49 -
 50
50 -
 51
51 -
 52
52 -
 53
53 -
 54
54 -
 55
55 -
 56
56 -
 57
57 -
 58
58 -
 59
59 -
 60
60 -
 61
61 -
 62
62 -
63
-
64
-
65
-
66
-
67
-
68
-
69
-
70
-
71
-
72
-
73
-
74
-
75
-
76
-
77
-
78
-
79
-
80
-
81
-
82
-
83
-
84
-
85
-
86
-
87
-
88
-
89
-
90
-
91
-
92
-
93
-
94
-
95
-
96
-
97
-
98
-
99
-
100
-
101
-
102
-
103
-
104
-
105
-
106
-
107
-
108
-
109
-
110
-
111
-
112
-
113
-
114
-
115
-
116
-
117
-
118
-
119
-
120
-
121
-
122
-
123
-
124
-
125
-
126
-
127
-
128
-
129
-
130
-
131
-
132
-
133
-
134
-
135
-
136
 |
 |

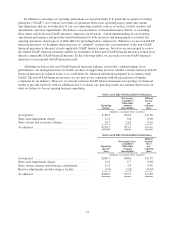
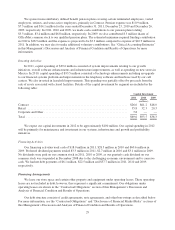
NON-GAAP RECONCILIATION FOR 2009(a)
Operating
income
(loss)
Net income
(loss)
available to
OfficeMax
common
shareholders
Diluted
income
(loss)
per
common
share
(millions, except per-share amounts)
As reported ............................................... $(4.0) $ (2.2) $(0.03)
Store asset impairment charge ................................ 17.6 10.0 0.12
Store closure and severance charges ........................... 49.3 30.0 0.39
Interest income from a legacy tax escrow ....................... — (2.7) (0.04)
Boise Cascade Holdings, L.L.C. distribution .................... — (1.6) (0.02)
Release of income tax uncertainty reserve ...................... — (14.9) (0.18)
As adjusted ............................................... $62.9 $ 18.6 $ 0.24
(a) Totals may not foot due to rounding.
These items are described in more detail in this Management’s Discussion and Analysis.
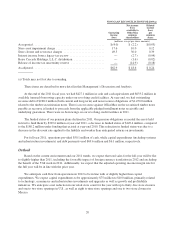
At the end of the 2011 fiscal year, we had $427.1 million in cash and cash equivalents and $633.2 million in
available (unused) borrowing capacity under our revolving credit facilities. At year-end, we had outstanding
recourse debt of $268.2 million (both current and long-term) and non-recourse obligations of $1,470.0 million
related to the timber securitization notes. There is no recourse against OfficeMax on the securitized timber notes
payable as recourse is limited to proceeds from the applicable pledged installment notes receivable and
underlying guarantees. There were no borrowings on our revolving credit facilities in 2011.
The funded status of our pension plans declined in 2011. Our pension obligations exceeded the assets held
in trust to fund them by $329.6 million at year-end 2011, a decrease in funded status of $149.4 million, compared
to the $180.2 million under funding that existed at year-end 2010. This reduction in funded status was due to a
decrease in the discount rate applied to the liability and weaker than anticipated returns on investments.
For full year 2011, operations provided $50.1 million of cash, while capital expenditures (including systems
and infrastructure investments) and debt payments used $69.6 million and $6.1 million, respectively.
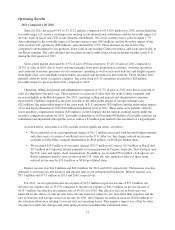
Outlook
Based on the current environment and our 2011 trends, we expect that total sales for the full year will be flat
to slightly higher than 2011, including the favorable impact of foreign currency translation in 2012 and excluding
the benefit of the 53rd week in 2011. Additionally, we expect that the adjusted operating income margin rate for
the full year will be in line with the prior year.
We anticipate cash flow from operations in 2012 to be in line with or slightly higher than capital
expenditures. We expect capital expenditures to be approximately $75 million to $100 million, primarily related
to technology, ecommerce and infrastructure investments and upgrades as well as growth and profitability
initiatives. We anticipate a net reduction in our retail store count for the year with up to thirty-five store closures
and one to two store openings in U.S., as well as eight to nine store openings and one to two store closures in
Mexico.
20