OfficeMax 2011 Annual Report Download - page 57
Download and view the complete annual report
Please find page 57 of the 2011 OfficeMax annual report below. You can navigate through the pages in the report by either clicking on the pages listed below, or by using the keyword search tool below to find specific information within the annual report.-
 1
1 -
2
-
3
-
4
-
5
-
6
-
7
-
8
-
9
-
10
-
11
-
12
-
13
-
14
-
15
-
16
-
17
-
18
-
19
-
20
-
21
-
22
-
23
-
24
-
25
-
26
-
27
-
28
-
29
-
30
-
31
-
32
-
33
-
34
-
35
-
36
-
37
-
38
-
39
-
40
-
41
-
42
-
43
-
44
-
45
-
46
-
 47
47 -
 48
48 -
 49
49 -
 50
50 -
 51
51 -
 52
52 -
 53
53 -
 54
54 -
 55
55 -
 56
56 -
 57
57 -
 58
58 -
 59
59 -
 60
60 -
 61
61 -
 62
62 -
 63
63 -
 64
64 -
 65
65 -
 66
66 -
 67
67 -
68
-
69
-
70
-
71
-
72
-
73
-
74
-
75
-
76
-
77
-
78
-
79
-
80
-
81
-
82
-
83
-
84
-
85
-
86
-
87
-
88
-
89
-
90
-
91
-
92
-
93
-
94
-
95
-
96
-
97
-
98
-
99
-
100
-
101
-
102
-
103
-
104
-
105
-
106
-
107
-
108
-
109
-
110
-
111
-
112
-
113
-
114
-
115
-
116
-
117
-
118
-
119
-
120
-
121
-
122
-
123
-
124
-
125
-
126
-
127
-
128
-
129
-
130
-
131
-
132
-
133
-
134
-
135
-
136
 |
 |
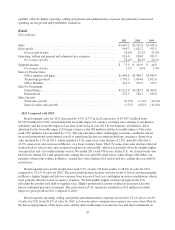
declines are the result of decreased sales to existing customers and several large customers that were not retained
in both Canada and Australia.
Contract segment gross profit margin decreased 0.5% of sales (50 basis points) to 22.3% of sales for 2011
compared to 22.8% of sales for the previous year. The decrease in gross profit margins occurred both in the U.S.
and internationally. U.S. gross profit margins decreased due to lower customer margins and increased freight and
delivery expenses from higher fuel costs, which were partially offset by lower occupancy expenses. The
continued highly competitive U.S. market has resulted in downward pressure on customer margins. The extra
week in U.S. operations resulted in a $7 million favorable impact to gross profit in 2011 compared to 2010.
International margin declines resulted from lower customer margins due to increased competitive market
conditions in Canada, and higher freight expense from higher fuel costs, which were partially offset by lower
inventory shrink expense and lower occupancy expense.
Contract segment operating, selling and general and administrative expenses of 20.2% of sales for 2011
were flat to the prior year as lower incentive compensation expense was offset by the deleveraging of expenses
from the lower sales and the unfavorable impact of sales/use tax settlements in 2010. Contract segment operating,
selling and general and administrative expenses of $731.8 million in 2011 decreased $0.9 million from the prior
year as the unfavorable impact of foreign currency rates ($20 million) and the unfavorable impact of the extra
week ($7 million) were offset by lower incentive compensation expense ($20 million) and lower payroll and
advertising expenses.
Contract segment income was $77.7 million, or 2.1% of sales, for 2011, compared to $94.3 million, or 2.6%
of sales, for 2010. The decrease in segment income was primarily attributable to the decline in sales and the
lower gross profit margin. The impact of the 53rd week was negligible on operating income.
2010 Compared with 2009
Contract segment sales for 2010 decreased 0.6% to $3,634.2 million from $3,656.7 million for 2009,
reflecting a 4.3% decline on a local currency basis which was partially offset by a favorable impact from changes
in foreign currency exchange rates. The U.S. sales decline of 3.9% reflected a challenging U.S. economic
recovery, which continues to impact our customers’ buying trends, as well as an intensely competitive
environment. Sales to existing customers declined 6.2% in 2010, an improvement from the 14.7% decline in
2009. For the year, increased sales to newly acquired customers outpaced reduced sales due to lost customers.
International sales declined 5.2% on a local currency basis in 2010, primarily as a result of decreased sales to
existing customers and continued international economic weakness.
Contract segment gross profit margin increased 2.0% of sales (200 basis points) to 22.8% of sales for 2010
compared to 20.8% of sales for the previous year. The increases in gross profit margins occurred both in the U.S.
and internationally. U.S. gross profit margins increased due to strong disciplines instituted to monitor both
customer profitability and product costs as well as reduced delivery costs. 2010 also benefited from the reversal
of inventory shrinkage reserves due to favorable results from our annual physical inventory counts of $3.5
million. International margin improvements resulted from improved product margins resulting from a strong
back-to-school season in Australia, favorable foreign exchange rate impact on Canadian paper purchases and
profitability initiatives related to our own private label products.
Contract segment operating, selling and general and administrative expenses increased 1.0% of sales to
20.2% for 2010 from 19.2% of sales a year earlier. The increase was primarily due to costs associated with
growth and profitability initiatives associated with our managed-print-services, customer service centers and
business-to-business website, partially offset by favorable trends in workers compensation and medical benefit
expenses as well as lower payroll costs from the reorganization of our U.S. sales force and U.S. customer service
operations.
Contract segment income was $94.3 million, or 2.6% of sales, for 2010, compared to $58.0 million, or 1.6%
of sales, for 2009. The increase in segment income was primarily attributable to the increased gross profit margin
25