OfficeMax 2011 Annual Report Download - page 109
Download and view the complete annual report
Please find page 109 of the 2011 OfficeMax annual report below. You can navigate through the pages in the report by either clicking on the pages listed below, or by using the keyword search tool below to find specific information within the annual report.-
 1
1 -
2
-
3
-
4
-
5
-
6
-
7
-
8
-
9
-
10
-
11
-
12
-
13
-
14
-
15
-
16
-
17
-
18
-
19
-
20
-
21
-
22
-
23
-
24
-
25
-
26
-
27
-
28
-
29
-
30
-
31
-
32
-
33
-
34
-
35
-
36
-
37
-
38
-
39
-
40
-
41
-
42
-
43
-
44
-
45
-
46
-
47
-
48
-
49
-
50
-
51
-
52
-
53
-
54
-
55
-
56
-
57
-
58
-
59
-
60
-
61
-
62
-
63
-
64
-
65
-
66
-
67
-
68
-
69
-
70
-
71
-
72
-
73
-
74
-
75
-
76
-
77
-
78
-
79
-
80
-
81
-
82
-
83
-
84
-
85
-
86
-
87
-
88
-
89
-
90
-
91
-
92
-
93
-
94
-
95
-
96
-
97
-
98
-
 99
99 -
 100
100 -
 101
101 -
 102
102 -
 103
103 -
 104
104 -
 105
105 -
 106
106 -
 107
107 -
 108
108 -
 109
109 -
 110
110 -
 111
111 -
 112
112 -
 113
113 -
 114
114 -
 115
115 -
 116
116 -
 117
117 -
 118
118 -
 119
119 -
120
-
121
-
122
-
123
-
124
-
125
-
126
-
127
-
128
-
129
-
130
-
131
-
132
-
133
-
134
-
135
-
136
 |
 |

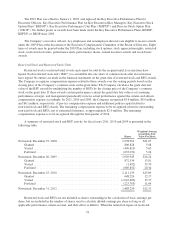
in-store module devoted to print-for-pay and related services. Retail has operations in the United States, Puerto
Rico and the U.S. Virgin Islands. The retail segment also operates office products stores in Mexico through a
51%-owned joint venture. Substantially all products sold by Retail are purchased from third-party manufacturers
or industry wholesalers. Retail purchases office papers primarily from Boise White Paper, L.L.C., under the
paper supply contract described above.
Corporate and Other includes corporate support staff services and certain other legacy expenses as well as
the related assets and liabilities. The income and expense related to certain assets and liabilities that are reported
in the Corporate and Other segment have been allocated to the Contract and Retail segments.
Management evaluates the segments’ performances using segment income (loss) which is based on
operating income (loss) after eliminating the effect of certain operating items that are not indicative of our core
operations such as severances, facility closures and adjustments, and asset impairments. These certain operating
items are reported on the asset impairments and the other operating expenses, net lines in the Consolidated
Statements of Operations.
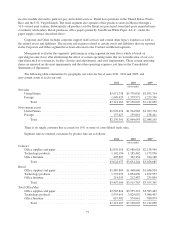
The following table summarizes by geography, net sales for fiscal years 2011, 2010 and 2009, and
non-current assets at each year-end:
2011 2010 2009
(thousands)
Net sales
United States ........................................... $5,671,738 $5,770,036 $5,952,714
Foreign ............................................... 1,449,429 1,379,971 1,259,336
Total ............................................. $7,121,167 $7,150,007 $7,212,050
Non-current assets
United States ........................................... $1,992,674 $1,924,982 $1,909,754
Foreign ............................................... 137,627 139,661 138,441
Total ............................................. $2,130,301 $2,064,643 $2,048,195
There is no single customer that accounts for 10% or more of consolidated trade sales.
Segment sales to external customers by product line are as follows:
2011 2010 2009
(thousands)
Contract
Office supplies and paper ................................. $2,076,014 $2,086,628 $2,138,549
Technology products ..................................... 1,142,196 1,185,462 1,173,956
Office furniture ......................................... 405,867 362,154 344,180
Total ............................................. $3,624,077 $3,634,244 $3,656,685
Retail
Office supplies and paper ................................. $1,489,800 $1,468,646 $1,446,934
Technology products ..................................... 1,793,255 1,834,630 1,872,537
Office furniture ......................................... 214,035 212,487 235,894
Total ............................................. $3,497,090 $3,515,763 $3,555,365
Total OfficeMax
Office supplies and paper ................................. $3,565,814 $3,555,274 $3,585,483
Technology products ..................................... 2,935,451 3,020,092 3,046,493
Office furniture ......................................... 619,902 574,641 580,074
Total ............................................. $7,121,167 $7,150,007 $7,212,050
77