OfficeMax 2011 Annual Report Download - page 101
Download and view the complete annual report
Please find page 101 of the 2011 OfficeMax annual report below. You can navigate through the pages in the report by either clicking on the pages listed below, or by using the keyword search tool below to find specific information within the annual report.-
 1
1 -
2
-
3
-
4
-
5
-
6
-
7
-
8
-
9
-
10
-
11
-
12
-
13
-
14
-
15
-
16
-
17
-
18
-
19
-
20
-
21
-
22
-
23
-
24
-
25
-
26
-
27
-
28
-
29
-
30
-
31
-
32
-
33
-
34
-
35
-
36
-
37
-
38
-
39
-
40
-
41
-
42
-
43
-
44
-
45
-
46
-
47
-
48
-
49
-
50
-
51
-
52
-
53
-
54
-
55
-
56
-
57
-
58
-
59
-
60
-
61
-
62
-
63
-
64
-
65
-
66
-
67
-
68
-
69
-
70
-
71
-
72
-
73
-
74
-
75
-
76
-
77
-
78
-
79
-
80
-
81
-
82
-
83
-
84
-
85
-
86
-
87
-
88
-
89
-
90
-
 91
91 -
 92
92 -
 93
93 -
 94
94 -
 95
95 -
 96
96 -
 97
97 -
 98
98 -
 99
99 -
 100
100 -
 101
101 -
 102
102 -
 103
103 -
 104
104 -
 105
105 -
 106
106 -
 107
107 -
 108
108 -
 109
109 -
 110
110 -
 111
111 -
112
-
113
-
114
-
115
-
116
-
117
-
118
-
119
-
120
-
121
-
122
-
123
-
124
-
125
-
126
-
127
-
128
-
129
-
130
-
131
-
132
-
133
-
134
-
135
-
136
 |
 |

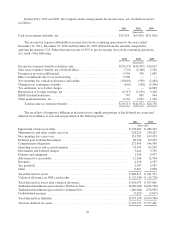
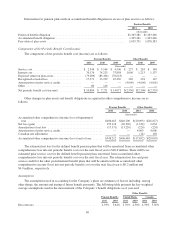
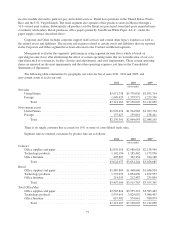
Information for pension plans with an accumulated benefit obligation in excess of plan assets is as follows:
Pension Benefits
2011 2010
(thousands)
Projected benefit obligation ................................................... $1,365,281 $1,263,206
Accumulated benefit obligation ................................................ 1,365,281 1,263,206
Fair value of plan assets ...................................................... 1,035,731 1,078,383
Components of Net Periodic Benefit Cost (Income)
The components of net periodic benefit cost (income) are as follows:
Pension Benefits Other Benefits
2011 2010 2009 2011 2010 2009
(thousands)
Service cost ................................. $ 2,546 $ 3,164 $ 4,506 $ 227 $ 263 $ 184
Interest cost ................................. 70,176 74,213 75,858 1,006 1,213 1,137
Expected return on plan assets ................... (79,289) (83,494) (76,623) — — —
Recognized actuarial loss ...................... 17,371 13,239 10,330 220 224 147
Amortization of prior service credits .............. — — — (4,009) (4,006) (4,001)
Other ...................................... 80 149 ————
Net periodic benefit cost (income) ............... $10,884 $ 7,271 $ 14,071 $(2,556) $(2,306) $(2,533)
Other changes in plan assets and benefit obligations recognized in other comprehensive income are as
follows:
Pension Benefits Other Benefits
2011 2010 2011 2010
(thousands)
Accumulated other comprehensive (income) loss at beginning of
year .................................................... $406,465 $440,206 $(20,093) $(26,627)
Net loss (gain) .............................................. 159,118 (20,502) (1,334) 2,634
Amortization of net loss ...................................... (17,371) (13,239) (220) (224)
Amortization of prior service credits ............................. — — 4,009 4,006
Canadian rate adjustment ..................................... — — (14) 118
Accumulated other comprehensive (income) loss at end of year ....... $548,212 $406,465 $(17,652) $(20,093)
The estimated net loss for the defined benefit pension plans that will be amortized from accumulated other
comprehensive loss into net periodic benefit cost over the next fiscal year is $18.0 million. There will be no
estimated prior service cost for the defined benefit pension plans amortized from accumulated other
comprehensive loss into net periodic benefit cost over the next fiscal year. The estimated net loss and prior
service credit for the other postretirement benefit plans that will be amortized from accumulated other
comprehensive income (loss) into net periodic benefit cost over the next fiscal year is $0.2 million and
$4.0 million, respectively.
Assumptions
The assumptions used in accounting for the Company’s plans are estimates of factors including, among
other things, the amount and timing of future benefit payments. The following table presents the key weighted
average assumptions used in the measurement of the Company’s benefit obligations as of year-end:
Other Benefits
Pension Benefits United States Canada
2011 2010 2011 2010 2011 2010
Discount rate ........................................... 4.93% 5.64% 3.70% 4.50% 4.50% 5.30%
69