OfficeMax 2011 Annual Report Download - page 106
Download and view the complete annual report
Please find page 106 of the 2011 OfficeMax annual report below. You can navigate through the pages in the report by either clicking on the pages listed below, or by using the keyword search tool below to find specific information within the annual report.-
 1
1 -
2
-
3
-
4
-
5
-
6
-
7
-
8
-
9
-
10
-
11
-
12
-
13
-
14
-
15
-
16
-
17
-
18
-
19
-
20
-
21
-
22
-
23
-
24
-
25
-
26
-
27
-
28
-
29
-
30
-
31
-
32
-
33
-
34
-
35
-
36
-
37
-
38
-
39
-
40
-
41
-
42
-
43
-
44
-
45
-
46
-
47
-
48
-
49
-
50
-
51
-
52
-
53
-
54
-
55
-
56
-
57
-
58
-
59
-
60
-
61
-
62
-
63
-
64
-
65
-
66
-
67
-
68
-
69
-
70
-
71
-
72
-
73
-
74
-
75
-
76
-
77
-
78
-
79
-
80
-
81
-
82
-
83
-
84
-
85
-
86
-
87
-
88
-
89
-
90
-
91
-
92
-
93
-
94
-
95
-
 96
96 -
 97
97 -
 98
98 -
 99
99 -
 100
100 -
 101
101 -
 102
102 -
 103
103 -
 104
104 -
 105
105 -
 106
106 -
 107
107 -
 108
108 -
 109
109 -
 110
110 -
 111
111 -
 112
112 -
 113
113 -
 114
114 -
 115
115 -
 116
116 -
117
-
118
-
119
-
120
-
121
-
122
-
123
-
124
-
125
-
126
-
127
-
128
-
129
-
130
-
131
-
132
-
133
-
134
-
135
-
136
 |
 |

The 2003 Plan was effective January 1, 2003, and replaced the Key Executive Performance Plan for
Executive Officers, Key Executive Performance Plan for Key Executives/Key Managers, Key Executive Stock
Option Plan (“KESOP”), Key Executive Performance Unit Plan (“KEPUP”) and Director Stock Option Plan
(“DSOP”). No further grants or awards have been made under the Key Executive Performance Plans, KESOP,
KEPUP, or DSOP since 2003.
The Company’s executive officers, key employees and nonemployee directors are eligible to receive awards
under the 2003 Plan at the discretion of the Executive Compensation Committee of the Board of Directors. Eight
types of awards may be granted under the 2003 Plan, including stock options, stock appreciation rights, restricted
stock, restricted stock units, performance units, performance shares, annual incentive awards and stock bonus
awards.
Restricted Stock and Restricted Stock Units
Restricted stock is restricted until it vests and cannot be sold by the recipient until its restrictions have
lapsed. Each restricted stock unit (“RSU”) is convertible into one share of common stock after its restrictions
have lapsed. No entries are made in the financial statements on the grant date of restricted stock and RSU awards.
The Company recognizes compensation expense related to these awards over the vesting periods based on the
closing price of the Company’s common stock on the grant dates. The Company calculates the grant date fair
value of the RSU awards by multiplying the number of RSUs by the closing price of the Company’s common
stock on the grant date. If these awards contain performance criteria the grant date fair value is set assuming
performance at target, and management periodically reviews actual performance against the criteria and adjusts
compensation expense accordingly. In 2011, 2010 and 2009, the Company recognized $5.6 million, $8.0 million
and $6.1 million, respectively, of pre-tax compensation expense and additional paid-in capital related to
restricted stock and RSU awards. The remaining compensation expense to be recognized related to outstanding
restricted stock and RSUs, net of estimated forfeitures, is approximately $2.0 million. The remaining
compensation expense is to be recognized through the first quarter of 2014.
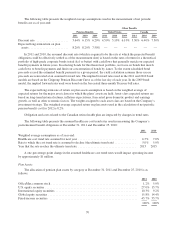
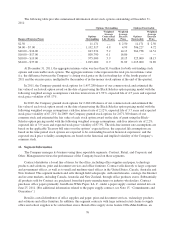
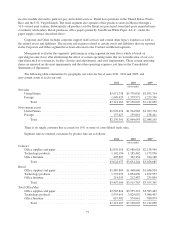
A summary of restricted stock and RSU activity for fiscal years 2011, 2010 and 2009 is presented in the
following table:
Shares
Weighted-Average
Grant Date Fair
Value Per Share
Nonvested, December 27, 2008 ........................................ 2,258,961 $31.07
Granted ....................................................... 800,828 5.08
Vested ........................................................ (496,813) 5.65
Forfeited ...................................................... (633,031) 5.24
Nonvested, December 26, 2009 ........................................ 1,929,945 $16.24
Granted ....................................................... 872,534 13.81
Vested ........................................................ (1,492) 33.70
Forfeited ...................................................... (689,852) 20.34
Nonvested, December 25, 2010 ........................................ 2,111,135 $13.89
Granted ....................................................... 648,224 12.17
Vested ........................................................ (1,047,406) 15.77
Forfeited ...................................................... (223,703) 11.64
Nonvested, December 31, 2011 ........................................ 1,488,250 $12.15
Restricted stock and RSUs are not included as shares outstanding in the calculation of basic earnings per
share, but are included in the number of shares used to calculate diluted earnings per share as long as all
applicable performance criteria are met, and their effect is dilutive. When the restriction lapses on restricted
74