OfficeMax 2011 Annual Report Download - page 108
Download and view the complete annual report
Please find page 108 of the 2011 OfficeMax annual report below. You can navigate through the pages in the report by either clicking on the pages listed below, or by using the keyword search tool below to find specific information within the annual report.-
 1
1 -
2
-
3
-
4
-
5
-
6
-
7
-
8
-
9
-
10
-
11
-
12
-
13
-
14
-
15
-
16
-
17
-
18
-
19
-
20
-
21
-
22
-
23
-
24
-
25
-
26
-
27
-
28
-
29
-
30
-
31
-
32
-
33
-
34
-
35
-
36
-
37
-
38
-
39
-
40
-
41
-
42
-
43
-
44
-
45
-
46
-
47
-
48
-
49
-
50
-
51
-
52
-
53
-
54
-
55
-
56
-
57
-
58
-
59
-
60
-
61
-
62
-
63
-
64
-
65
-
66
-
67
-
68
-
69
-
70
-
71
-
72
-
73
-
74
-
75
-
76
-
77
-
78
-
79
-
80
-
81
-
82
-
83
-
84
-
85
-
86
-
87
-
88
-
89
-
90
-
91
-
92
-
93
-
94
-
95
-
96
-
97
-
 98
98 -
 99
99 -
 100
100 -
 101
101 -
 102
102 -
 103
103 -
 104
104 -
 105
105 -
 106
106 -
 107
107 -
 108
108 -
 109
109 -
 110
110 -
 111
111 -
 112
112 -
 113
113 -
 114
114 -
 115
115 -
 116
116 -
 117
117 -
 118
118 -
119
-
120
-
121
-
122
-
123
-
124
-
125
-
126
-
127
-
128
-
129
-
130
-
131
-
132
-
133
-
134
-
135
-
136
 |
 |

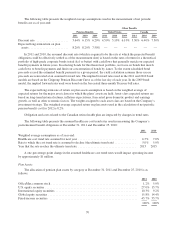
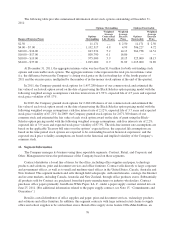
The following table provides summarized information about stock options outstanding at December 31,
2011:
Options Outstanding Options Exercisable
Range of Exercise Prices
Options
Outstanding
Weighted
Average
Contractual
Life (Years)
Weighted
Average
Exercise
Price
Options
Exercisable
Weighted
Average
Exercise
Price
$2.50 ..................................... 11,171 — $ 2.50 11,171 $ 2.50
$4.00 – $7.00 ............................... 1,192,317 4.8 4.99 506,227 4.72
$10.00 – $16.00 ............................. 813,274 5.2 14.13 264,738 14.51
$16.00 – $17.00 ............................. 809,790 6.1 16.86 — —
$18.00 – $19.00 ............................. 975,000 5.9 18.15 325,000 18.15
$24.00 – $37.00 ............................. 1,015,000 0.9 31.89 1,015,000 31.89
At December 31, 2011, the aggregate intrinsic value was less than $1.0 million for both outstanding stock
options and exercisable stock options. The aggregate intrinsic value represents the total pre-tax intrinsic value
(i.e. the difference between the Company’s closing stock price on the last trading day of the fourth quarter of
2011 and the exercise price, multiplied by the number of in-the-money stock options at the end of the quarter).
In 2011, the Company granted stock options for 1,457,280 shares of our common stock and estimated the
fair value of each stock option award on the date of grant using the Black-Scholes option pricing model with the
following weighted average assumptions: risk-free interest rate of 1.92%, expected life of 4.5 years and expected
stock price volatility of 65.17%.
In 2010, the Company granted stock options for 2,060,246 shares of our common stock and estimated the
fair value of each stock option award on the date of grant using the Black-Scholes option pricing model with the
following weighted average assumptions: risk-free interest rate of 2.12%, expected life of 3.7 years and expected
stock price volatility of 67.21%. In 2009, the Company granted stock options for 2,071,360 shares of our
common stock and estimated the fair value of each stock option award on the date of grant using the Black-
Scholes option pricing model with the following weighted average assumptions: risk-free interest rate of 2.2%,
expected life of 3.0 years and expected stock price volatility of 87.3%. The risk-free interest rate assumptions are
based on the applicable Treasury bill rates over the options’ expected lives; the expected life assumptions are
based on the time period stock options are expected to be outstanding based on historical experience; and the
expected stock price volatility assumptions are based on the historical and implied volatility of the Company’s
common stock.
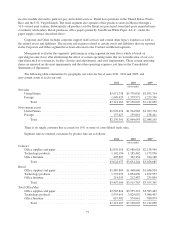
14. Segment Information
The Company manages its business using three reportable segments: Contract, Retail, and Corporate and
Other. Management reviews the performance of the Company based on these segments.
Contract distributes a broad line of items for the office, including office supplies and paper, technology
products and solutions, print and document services and office furniture. Contract sells directly to large corporate
and government offices, as well as to small and medium-sized offices in the United States, Canada, Australia and
New Zealand. This segment markets and sells through field salespeople, outbound telesales, catalogs, the Internet
and in some markets, including Canada, Australia and New Zealand, through office products stores. Substantially
all products sold by Contract are purchased from third-party manufacturers or industry wholesalers. Contract
purchases office papers primarily from Boise White Paper, L.L.C., under a paper supply contract entered into on
June 25, 2011. (For additional information related to the paper supply contract, see Note 15, “Commitments and
Guarantees”.)
Retail is a retail distributor of office supplies and paper, print and document services, technology products
and solutions and office furniture. In addition, this segment contracts with large national retail chains to supply
office and school supplies to be sold in their stores. Retail office supply stores feature OfficeMax ImPress, an
76