Nordstrom 2010 Annual Report Download - page 68
Download and view the complete annual report
Please find page 68 of the 2010 Nordstrom annual report below. You can navigate through the pages in the report by either clicking on the pages listed below, or by using the keyword search tool below to find specific information within the annual report.-
 1
1 -
2
-
3
-
4
-
5
-
6
-
7
-
8
-
9
-
10
-
11
-
12
-
13
-
14
-
15
-
16
-
17
-
18
-
19
-
20
-
21
-
22
-
23
-
24
-
25
-
26
-
27
-
28
-
29
-
30
-
31
-
32
-
33
-
34
-
35
-
36
-
37
-
38
-
39
-
40
-
41
-
42
-
43
-
44
-
45
-
46
-
47
-
48
-
49
-
50
-
51
-
52
-
53
-
54
-
55
-
56
-
57
-
 58
58 -
 59
59 -
 60
60 -
 61
61 -
 62
62 -
 63
63 -
 64
64 -
 65
65 -
 66
66 -
 67
67 -
 68
68 -
 69
69 -
 70
70 -
 71
71 -
 72
72 -
 73
73 -
 74
74 -
 75
75 -
 76
76 -
 77
77 -
 78
78 -
79
-
80
-
81
-
82
-
83
-
84
-
85
-
86
-
87
-
88
 |
 |

60
Nordstrom, Inc.
Notes to Consolidated Financial Statements
Dollar and share amounts in millions except per share, per option and unit amounts
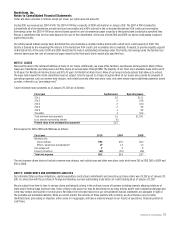
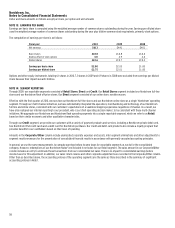
Within our reportable segments we also monitor sales by channel, as we believe sales are an important measure of our performance. Net sales by
channel were as follows:
Fiscal year 2010 2009 2008
Nordstrom full-line stores $6,995 $6,360 $6,630
Direct 705 563 501
Nordstrom 7,700 6,923 7,131
Nordstrom Rack and other 1,720 1,440 1,241
Total Retail segment sales 9,420 8,363 8,372
Corporate/Other (110) (105) (100)
Total net sales $9,310 $8,258 $8,272
Online orders fulfilled from our Nordstrom full-line stores are included in Direct sales. Items purchased online and picked up in our Nordstrom
full-line stores are included in Nordstrom full-line store sales. Prior to February 2010, merchandise purchased from our online store that was later
returned to our Nordstrom full-line stores was reported as a deduction from Nordstrom full-line store sales. Beginning in February 2010, we now
deduct these returns from Direct sales instead of from Nordstrom full-line store sales in order to better align sales and sales returns within each
channel. For purposes of comparison, 2009 and 2008 net sales results for both Nordstrom full-line stores and Direct have been revised to reflect
this realignment of returns. This realignment of sales returns between channels had no effect on total Retail segment sales.
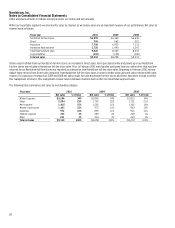
The following table summarizes net sales by merchandise category:
Fiscal year 2010 2009 2008
Net sales % of total Net sales % of total Net sales % of total
Women’s apparel $3,184 34% $2,845 34% $2,812 34%
Shoes 2,094 23% 1,787 22% 1,721 21%
Men’s apparel 1,415 15% 1,262 15% 1,362 16%
Women’s accessories 1,101 12% 970 12% 963 12%
Cosmetics 972 10% 895 11% 921 11%
Children’s apparel 303 3% 283 3% 269 3%
Other 241 3% 216 3% 224 3%
Total net sales $9,310 100% $8,258 100% $8,272 100%