Nordstrom 2010 Annual Report Download - page 41
Download and view the complete annual report
Please find page 41 of the 2010 Nordstrom annual report below. You can navigate through the pages in the report by either clicking on the pages listed below, or by using the keyword search tool below to find specific information within the annual report.-
 1
1 -
2
-
3
-
4
-
5
-
6
-
7
-
8
-
9
-
10
-
11
-
12
-
13
-
14
-
15
-
16
-
17
-
18
-
19
-
20
-
21
-
22
-
23
-
24
-
25
-
26
-
27
-
28
-
29
-
30
-
 31
31 -
 32
32 -
 33
33 -
 34
34 -
 35
35 -
 36
36 -
 37
37 -
 38
38 -
 39
39 -
 40
40 -
 41
41 -
 42
42 -
 43
43 -
 44
44 -
 45
45 -
 46
46 -
 47
47 -
 48
48 -
 49
49 -
 50
50 -
 51
51 -
52
-
53
-
54
-
55
-
56
-
57
-
58
-
59
-
60
-
61
-
62
-
63
-
64
-
65
-
66
-
67
-
68
-
69
-
70
-
71
-
72
-
73
-
74
-
75
-
76
-
77
-
78
-
79
-
80
-
81
-
82
-
83
-
84
-
85
-
86
-
87
-
88
 |
 |

Nordstrom, Inc. and subsidiaries 33
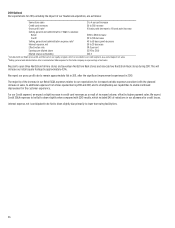
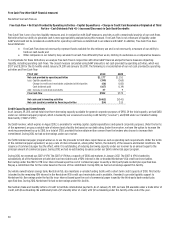
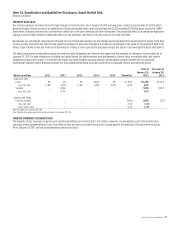
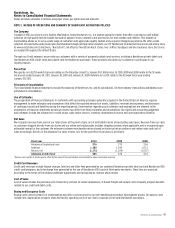
Contractual Obligations
The following table summarizes our contractual obligations and the expected effect on our liquidity and cash flows as of January 29, 2011. We expect to
fund these commitments primarily with operating cash flows generated in the normal course of business and credit available to us under existing and
potential future facilities.
Total
Less than
1 year 1–3 years 3–5 years
More than
5 years
Long-term debt $4,384 $148 $792 $646 $2,798
Capital lease obligations 15 2 4 5 4
Operating leases 1,031 111 208 188 524
Purchase obligations 1,302 1,207 66 21 8
Other long-term liabilities 237 15 39 28 155
Total $6,969 $1,483 $1,109 $888 $3,489
Included in the required debt repayments disclosed above are estimated total interest payments of $1,638 as of January 29, 2011, payable over the
remaining life of the debts.
The capital and operating lease obligations in the table above do not include payments for operating expenses that are required by most of our lease
agreements. Such expenses, which include common area charges, real estate taxes and other executory costs, totaled $65 in 2010, $60 in 2009 and $56
in 2008. In addition, some of our leases require additional rental payments based on a percentage of our sales, referred to as “percentage rent.”
Percentage rent, which is also excluded from the obligations in the table above, was $9 in each of 2010, 2009 and 2008.
Purchase obligations primarily consist of purchase orders for unreceived goods or services and capital expenditure commitments.
Other long-term liabilities consist of workers’ compensation and general liability insurance reserves and postretirement benefits. The payment
amounts presented above were estimated based on historical payment trends. Other long-term liabilities not requiring cash payments, such as
deferred property incentives and deferred revenue, were excluded from the table above. Also excluded from the table above are unrecognized tax
benefits of $21, as we are unable to reasonably estimate the timing of future cash payments, if any, for these liabilities.
We had no off-balance sheet arrangements, other than operating leases entered into in the normal course of business, during 2010.
CRITICAL ACCOUNTING ESTIMATES
The preparation of our financial statements requires that we make estimates and judgments that affect the reported amounts of assets, liabilities,
revenues and expenses, and disclosure of contingent assets and liabilities. We base our estimates on historical experience and other assumptions that
we believe to be reasonable under the circumstances. Actual results may differ from these estimates. The following discussion highlights the estimates
we believe are critical and should be read in conjunction with the Notes to Consolidated Financial Statements in Item 8. Our management has discussed
the development and selection of these critical accounting estimates with the Audit Committee of our Board of Directors and the Audit Committee has
reviewed our disclosures that follow.
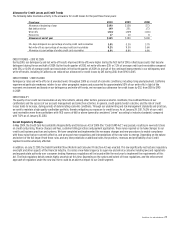
Allowance for Credit Losses
The allowance for credit losses reflects our best estimate of the losses inherent in our receivables as of the balance sheet date, including uncollectible
finance charges and fees. We estimate such credit losses based on several factors, including historical aging and delinquency trends, write-off
experience, concentration and risk metrics, and general economic conditions.
We believe the allowance for credit losses is adequate to cover anticipated losses in our credit card receivables under current conditions; however,
significant deterioration in any of the factors mentioned above could materially change these expectations. During 2009, increases in unemployment
and associated delinquency and write-off trends prompted us to record significant increases to our allowance for credit losses, which increased from
$138 at January 31, 2009 to $190 at January 30, 2010. As credit trends began to improve during 2010, we reduced our allowance for credit losses by $45,
from $190 at January 30, 2010 to $145 at January 29, 2011. A 10% change in our allowance for credit losses would have affected net earnings by $9 for
the fiscal year ended January 29, 2011.
Revenue Recognition
We recognize revenue from sales at our retail stores at the point of sale, net of an allowance for estimated sales returns. We estimate customer
merchandise returns based on historical return patterns and reduce sales and cost of sales accordingly.
Although we believe we have sufficient current and historical knowledge to record reasonable estimates of sales returns, there is a possibility that
actual returns could differ from recorded amounts. In the past three years, we have made no material changes to our estimates included in the
calculations of our sales return reserve. A 10% change in the sales return reserve would have had a $5 impact on our net earnings for the year ended
January 29, 2011.