Nordstrom 2010 Annual Report Download - page 29
Download and view the complete annual report
Please find page 29 of the 2010 Nordstrom annual report below. You can navigate through the pages in the report by either clicking on the pages listed below, or by using the keyword search tool below to find specific information within the annual report.-
 1
1 -
2
-
3
-
4
-
5
-
6
-
7
-
8
-
9
-
10
-
11
-
12
-
13
-
14
-
15
-
16
-
17
-
18
-
 19
19 -
 20
20 -
 21
21 -
 22
22 -
 23
23 -
 24
24 -
 25
25 -
 26
26 -
 27
27 -
 28
28 -
 29
29 -
 30
30 -
 31
31 -
 32
32 -
 33
33 -
 34
34 -
 35
35 -
 36
36 -
 37
37 -
 38
38 -
 39
39 -
40
-
41
-
42
-
43
-
44
-
45
-
46
-
47
-
48
-
49
-
50
-
51
-
52
-
53
-
54
-
55
-
56
-
57
-
58
-
59
-
60
-
61
-
62
-
63
-
64
-
65
-
66
-
67
-
68
-
69
-
70
-
71
-
72
-
73
-
74
-
75
-
76
-
77
-
78
-
79
-
80
-
81
-
82
-
83
-
84
-
85
-
86
-
87
-
88
 |
 |

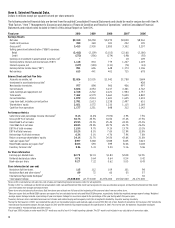
Nordstrom, Inc. and subsidiaries 21
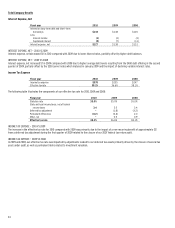
Credit Segment
The Nordstrom credit and debit card products are designed to strengthen customer relationships and grow retail sales by providing valuable services,
loyalty benefits and payment products. We believe that owning all aspects of our credit business allows us to fully integrate our rewards program with
our retail stores and provide better service to our customers, thus deepening our relationship with them and driving greater customer loyalty. Our
Nordstrom private label credit and debit cards can be used only in Nordstrom stores and on our website (“inside volume”), while our Nordstrom VISA
cards also may be used for purchases outside of Nordstrom (“outside volume”). Cardholders participate in the Nordstrom Fashion Rewards® program,
through which they accumulate points based on their level of spending (generally two points per dollar spent at Nordstrom and one point per dollar
spent outside of Nordstrom). Upon reaching two thousand points, customers receive twenty dollars in Nordstrom Notes®, which can be redeemed for
goods or services in our stores or online. As customers increase their level of spending they receive additional benefits, including rewards such as
complimentary shipping, early access to sale events and unique fashion and shopping events. Our cardholders tend to visit our stores more frequently
and spend more with us than non-cardholders. We believe the Fashion Rewards program helps drive sales in our Retail segment.
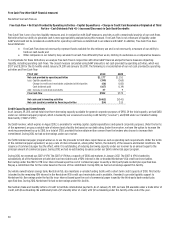
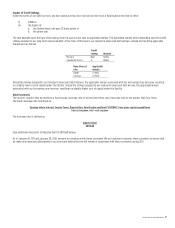
The table below provides a detailed view of the operational results of our Credit segment, consistent with the segment disclosure provided in the Notes
to Consolidated Financial Statements. In order to better reflect the economic contribution of our credit and debit card program, intercompany
merchant fees are also included in the table below. Intercompany merchant fees represent the estimated intercompany income of our Credit segment
from the usage of our cards in the Retail segment. To encourage the use of Nordstrom cards in our stores, the Credit segment does not charge the
Retail segment an intercompany interchange merchant fee. On a consolidated basis, we avoid costs that would be incurred if our customers used
third-party cards.
Interest expense is assigned to the Credit segment in proportion to the amount of estimated capital needed to fund our credit card receivables, which
assumes a mix of 80% debt and 20% equity. The average credit card receivable investment metric included in the following table represents our best
estimate of the amount of capital for our Credit segment that is financed by equity. Based on our research, debt as a percentage of credit card
receivables for other credit card companies ranges from 70% to 90%. We believe that debt equal to 80% of our credit card receivables is appropriate
given our overall capital structure goals.
Fiscal year 2010 2009 2008
Amount
% of credit
card
receivables
Amount
% of credit
card
receivables
Amount
% of credit
card
receivables
Finance charge revenue $266
12.7% $264 12.6% $215 11.3%
Interchange — third party 76 3.7% 71 3.4% 69 3.6%
Late fees and other revenue 48 2.3% 35 1.7% 18 0.9%
Total credit card revenues 390 18.7% 370 17.6% 302 15.8%
Interest expense (21) (1.0%) (41) (2.0%) (50) (2.6%)
Net credit card income 369 17.7% 329 15.7% 252 13.2%
Cost of sales and related buying and
occupancy costs — loyalty program
(66)
(3.2%)
(55)
(2.6%)
(50)
(2.7%)
Selling, general and administrative
expenses
(273)
(13.1%)
(356)
(17.0%)
(274)
(14.3%)
Total expense (339)
(16.3%)
(411)
(19.6%) (324)
(17.0%)
Credit segment earnings (loss) before
income taxes, as presented in
segment disclosure 30
1.4% (82)
(3.9%) (72)
(3.8%)
Intercompany merchant fees 58 2.8% 50 2.4% 48 2.5%
Credit segment contribution (loss),
before income taxes
$88
4.2%
$(32)
(1.5%)
$(24)
(1.3%)
Credit and debit card volume:
Outside $3,838
$3,603
$3,576
Inside 2,953 2,521 2,423
Total volume $6,791 $6,124 $5,999
Average credit card receivables $2,088 $2,099 $1,911
Average credit card receivable investment
(assuming 80% of accounts receivable
is funded with debt) $418
$420
$382
Credit segment contribution (loss), net of
tax, as a percentage of average credit
card receivable investment
12.8%
(4.7%)
(3.9%)