Nordstrom 2010 Annual Report Download - page 56
Download and view the complete annual report
Please find page 56 of the 2010 Nordstrom annual report below. You can navigate through the pages in the report by either clicking on the pages listed below, or by using the keyword search tool below to find specific information within the annual report.-
 1
1 -
2
-
3
-
4
-
5
-
6
-
7
-
8
-
9
-
10
-
11
-
12
-
13
-
14
-
15
-
16
-
17
-
18
-
19
-
20
-
21
-
22
-
23
-
24
-
25
-
26
-
27
-
28
-
29
-
30
-
31
-
32
-
33
-
34
-
35
-
36
-
37
-
38
-
39
-
40
-
41
-
42
-
43
-
44
-
45
-
 46
46 -
 47
47 -
 48
48 -
 49
49 -
 50
50 -
 51
51 -
 52
52 -
 53
53 -
 54
54 -
 55
55 -
 56
56 -
 57
57 -
 58
58 -
 59
59 -
 60
60 -
 61
61 -
 62
62 -
 63
63 -
 64
64 -
 65
65 -
 66
66 -
67
-
68
-
69
-
70
-
71
-
72
-
73
-
74
-
75
-
76
-
77
-
78
-
79
-
80
-
81
-
82
-
83
-
84
-
85
-
86
-
87
-
88
 |
 |

48
Nordstrom, Inc.
Notes to Consolidated Financial Statements
Dollar and share amounts in millions except per share, per option and unit amounts
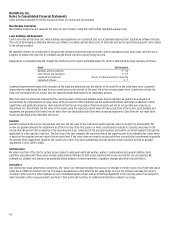
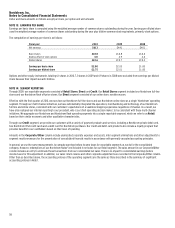
Activity in the allowance for credit losses for the past three fiscal years is as follows:
Fiscal year 2010 2009 2008
Allowance at beginning of year $190 $138 $73
Bad debt provision 149 251 173
Write-offs (211) (209) (116)
Recoveries 17 10 8
Allowance at end of year $145 $190 $138
For purposes of determining impairment and recording the associated allowance for credit losses, we evaluate our credit card receivables on a
collective basis as they are composed of large groups of smaller-balance homogeneous loans and therefore are not individually evaluated for
impairment. Under certain circumstances, we may make modifications to a customer’s payment terms that constitute a troubled debt restructuring
(“TDR”). These modifications typically result in reduced or waived fees and finance charges, and/or reduced minimum payments. Receivables
classified as TDRs were 2.7% and 4.3% of our total credit card receivables as of January 29, 2011 and January 30, 2010, and are included in the
collective evaluation of our credit card receivables in determining our allowance for credit losses.
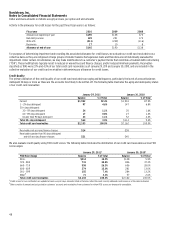
Credit Quality
The primary indicators of the credit quality of our credit card receivables are aging and delinquency, particularly the levels of account balances
delinquent 30 days or more as these are the accounts most likely to be written off. The following table illustrates the aging and delinquency status
of our credit card receivables:
January 29, 2011 January 30, 2010
Balance % of Total Balance % of Total
Current $1,942 92.4% $1,901 87.9%
1 – 29 days delinquent 97 4.6% 147 6.8%
30+ days delinquent:
30 – 59 days delinquent 24 1.1% 35 1.6%
60 – 89 days delinquent 17 0.8% 27 1.3%
Greater than 90 days delinquent 23 1.1% 52 2.4%
Total 30+ days delinquent $64 3.0% $114 5.3%
Total credit card receivables $2,103 100.0% $2,162 100.0%
Receivables not accruing finance charges $14 $38
Receivables greater than 90 days delinquent
and still accruing finance charges
$21
$45
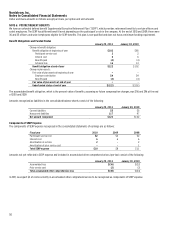
We also evaluate credit quality using FICO credit scores. The following table illustrates the distribution of our credit card receivables across FICO
score ranges:
January 29, 20111 January 30, 20101
FICO Score Range Balance % of Total Balance % of Total
801+ $314 14.9% $128 5.9%
720 – 800 731 34.8% 806 37.3%
660 – 719 558 26.5% 606 28.0%
600 – 659 274 13.0% 281 13.0%
001 – 599 155 7.4% 284 13.2%
Other2 71 3.4% 57 2.6%
Total credit card receivables $2,103 100.0% $2,162 100.0%
1Credit scores for our cardholders are updated at least every 60 days. Amounts listed in the table reflect the most recently obtained credit scores as of the dates indicated.
2Other consists of amounts not yet posted to customers’ accounts and receivables from customers for whom FICO scores are temporarily unavailable.