Nordstrom 2010 Annual Report Download - page 64
Download and view the complete annual report
Please find page 64 of the 2010 Nordstrom annual report below. You can navigate through the pages in the report by either clicking on the pages listed below, or by using the keyword search tool below to find specific information within the annual report.-
 1
1 -
2
-
3
-
4
-
5
-
6
-
7
-
8
-
9
-
10
-
11
-
12
-
13
-
14
-
15
-
16
-
17
-
18
-
19
-
20
-
21
-
22
-
23
-
24
-
25
-
26
-
27
-
28
-
29
-
30
-
31
-
32
-
33
-
34
-
35
-
36
-
37
-
38
-
39
-
40
-
41
-
42
-
43
-
44
-
45
-
46
-
47
-
48
-
49
-
50
-
51
-
52
-
53
-
 54
54 -
 55
55 -
 56
56 -
 57
57 -
 58
58 -
 59
59 -
 60
60 -
 61
61 -
 62
62 -
 63
63 -
 64
64 -
 65
65 -
 66
66 -
 67
67 -
 68
68 -
 69
69 -
 70
70 -
 71
71 -
 72
72 -
 73
73 -
 74
74 -
75
-
76
-
77
-
78
-
79
-
80
-
81
-
82
-
83
-
84
-
85
-
86
-
87
-
88
 |
 |

56
Nordstrom, Inc.
Notes to Consolidated Financial Statements
Dollar and share amounts in millions except per share, per option and unit amounts
Performance Share Units
We grant performance share units to executive officers as one of the ways to align compensation with shareholder interests. Performance share
units vest after a three-year period only when our total shareholder return (reflecting daily stock price appreciation and compounded reinvestment
of dividends) is positive and outperforms companies in a defined group of competitors determined by the Compensation Committee of our Board of
Directors. The percentage of units that are earned depends on our relative position at the end of the vesting period and can range from 0% to 125%
of the number of units granted.
Performance share units are payable in either cash or stock as elected by the employee; therefore, they are classified as a liability award. The
liability is remeasured, with a corresponding adjustment to earnings, at each fiscal quarter-end during the vesting period. The performance share
unit liability is remeasured using the estimated percentage of units earned multiplied by the closing market price of our common stock on the
current period-end date and is pro-rated based on the amount of time passed in the vesting period. The price used to issue stock or cash for the
performance share units upon vesting is the closing market price of our common stock on the vest date.
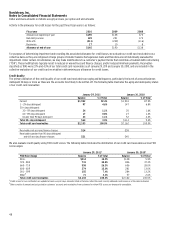
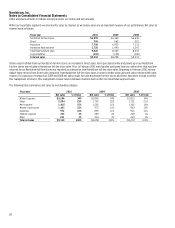
Following is a summary of performance share unit activity:
Fiscal year 2010 2009 2008
Outstanding, beginning of year 209,446 117,389 113,743
Granted 70,530 144,891 79,504
Vested but unearned - (44,827) (57,006)
Vested and earned (68,503) - -
Cancelled (12,287) (8,007) (18,852)
Outstanding, end of year 199,186 209,446 117,389
Total fair value of performance share units earned $2 - -
Total fair value of performance share units settled
or to be settled in cash $2 - -
As of January 29, 2011 and January 30, 2010, our other liabilities included $6 and $3 for performance share units. As of January 31, 2009, we had no
liabilities related to performance share units. As of January 29, 2011, the remaining unrecognized stock-based compensation expense for unvested
performance share units was $2, which is expected to be recognized over a weighted average period of 12 months.
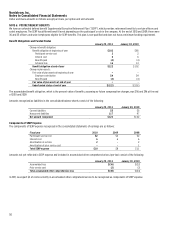
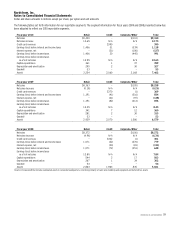
NOTE 12: INCOME TAXES
Income tax expense consists of the following:
Fiscal year 2010 2009 2008
Current income taxes:
Federal $324 $275 $244
State and local 52 38 39
Total current income tax expense 376 313 283
Deferred income taxes:
Current 2 (28) (29)
Non-current – (30) (7)
Total deferred income tax expense (benefit) 2 (58) (36)
Total income tax expense $378 $255 $247
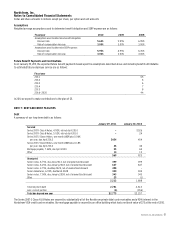
A reconciliation of the statutory Federal income tax rate to the effective tax rate on earnings before income taxes is as follows:
Fiscal year 2010 2009 2008
Statutory rate 35.0% 35.0% 35.0%
State and local income taxes, net of federal
income taxes 3.4 3.5 3.4
Deferred tax adjustment – (1.8) (3.2)
Permanent differences (0.2) (0.6) 2.0
Other, net – 0.5 0.9
Effective tax rate 38.2% 36.6% 38.1%