Nordstrom 2010 Annual Report Download - page 27
Download and view the complete annual report
Please find page 27 of the 2010 Nordstrom annual report below. You can navigate through the pages in the report by either clicking on the pages listed below, or by using the keyword search tool below to find specific information within the annual report.-
 1
1 -
2
-
3
-
4
-
5
-
6
-
7
-
8
-
9
-
10
-
11
-
12
-
13
-
14
-
15
-
16
-
 17
17 -
 18
18 -
 19
19 -
 20
20 -
 21
21 -
 22
22 -
 23
23 -
 24
24 -
 25
25 -
 26
26 -
 27
27 -
 28
28 -
 29
29 -
 30
30 -
 31
31 -
 32
32 -
 33
33 -
 34
34 -
 35
35 -
 36
36 -
 37
37 -
38
-
39
-
40
-
41
-
42
-
43
-
44
-
45
-
46
-
47
-
48
-
49
-
50
-
51
-
52
-
53
-
54
-
55
-
56
-
57
-
58
-
59
-
60
-
61
-
62
-
63
-
64
-
65
-
66
-
67
-
68
-
69
-
70
-
71
-
72
-
73
-
74
-
75
-
76
-
77
-
78
-
79
-
80
-
81
-
82
-
83
-
84
-
85
-
86
-
87
-
88
 |
 |

Nordstrom, Inc. and subsidiaries 19
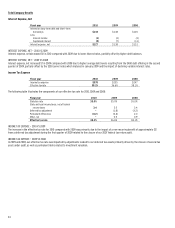
Nordstrom net sales were $7,700, up 11.2% compared with 2009, with same-store sales up 9.3%. The number of sales transactions increased in 2010
compared with 2009, while the average selling price of Nordstrom merchandise was approximately flat. Category highlights included jewelry, shoes and
dresses. The Midwest and South were the top-performing geographic regions for 2010. Our sales growth was due in large part to the success of our
merchandising, inventory management and multi-channel initiatives. In the fall of 2009, we updated our inventory platform to allow for shared
inventory across all of our Nordstrom full-line stores and our website, allowing us to fulfill online orders from any full-line store or from our fulfillment
center. These enhancements increased sales and led to significant improvements in our sell-through and inventory turnover rates beginning in the
second half of 2009 and continuing throughout 2010.
Nordstrom Rack net sales were $1,720, up 19.5% compared with 2009, while same-store sales increased 0.7% for the year. Cosmetics and shoes were
the strongest performing categories for the year. The number of sales transactions increased in 2010 compared with 2009, partially offset by declines
in the average selling price of Nordstrom Rack merchandise.
NET SALES — 2009 VS 2008
Net sales for 2009 were approximately flat compared with 2008. During 2009, we opened three Nordstrom full-line stores and thirteen Nordstrom Rack
stores. These stores represented 2.6% of our total net sales for 2009, and increased our gross square footage by 4.1% during 2009. Same-store sales
decreased 4.2%, with a decrease of 5.0% at Nordstrom, partially offset by an increase of 2.5% at Nordstrom Rack.
Nordstrom net sales were $6,923, down 2.9% compared with 2008, with same-store sales down 5.0%. Although the number of sales transactions
increased compared with 2008, the average selling price of our Nordstrom merchandise decreased. During 2009, we made continued progress on our
multi-channel strategy, providing our customers with easier access to more of our merchandise. These enhancements led to increased sales in the
second half of the year. Category highlights included women’s shoes, dresses and jewelry. The South and Mid-Atlantic were the top-performing
geographic regions for 2009.
Nordstrom Rack net sales were $1,440, up 16.0% compared with 2008, with same-store sales up 2.5%. The shoes and women’s apparel categories led
the positive performance for the year. In 2009, both the average selling price of Nordstrom Rack merchandise and the number of sales transactions
increased compared with 2008.
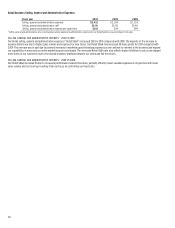
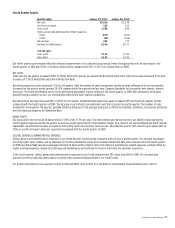
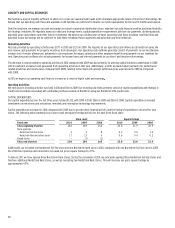
Retail Business Gross Profit
Fiscal year 2010 2009 2008
Gross profit1 $3,479 $2,985 $2,905
Gross profit rate2 37.4% 36.1% 35.1%
Inventory turnover rate3 5.56 5.41 5.20
1Gross profit is calculated as net sales less Retail Business cost of sales and related buying and occupancy costs. Retailers do not uniformly record the costs of buying and occupancy and
supply chain operations (freight, purchasing, receiving, distribution, etc.) between gross profit and selling, general and administrative expense. As such, our gross profit and selling,
general and administrative expenses and rates may not be comparable to other retailers’ expenses and rates.
2Gross profit rate is calculated as gross profit divided by net sales.
3Inventory turnover rate is calculated as annual cost of sales and related buying and occupancy costs (for all segments) divided by 4-quarter average inventory.
GROSS PROFIT — 2010 VS 2009
Retail gross profit increased $494 in 2010 compared with 2009 primarily due to higher sales and merchandise margin, partially offset by increases in
occupancy costs for new Nordstrom full-line and Nordstrom Rack stores opened during both 2010 and 2009. Our gross profit rate improved 123 basis
points compared with 2009 primarily due to improvement in our merchandise margin, as well as leveraging buying and occupancy costs on higher net
sales. As a result of our merchandising and multi-channel capabilities, we achieved increases in regular-priced selling along with a higher inventory
turnover rate. Our merchandising efforts enabled us to manage inventory levels consistent with sales trends and maintain fresh flow of merchandise
into our stores.
GROSS PROFIT — 2009 VS 2008
Retail gross profit in 2009 increased $80 from 2008 while our gross profit rate improved 101 basis points. The improvement in 2009 was driven by
improvement in our merchandise margin, particularly in the second half of the year. The latter half of 2008 was highly promotional among retailers,
meaning many competitors took steep markdowns and/or offered special events or incentives to attract customers, as sales declined. We were able to
be less promotional and reduce markdowns during 2009, particularly during the second half of the year, by aligning inventory with sales trends and
improving our inventory turnover rate. The improvement in our merchandise margin was offset by an increase in our buying and occupancy costs
primarily driven by performance-related incentives that were a result of strong company performance relative to our plans for 2009.