Nordstrom 2010 Annual Report Download - page 33
Download and view the complete annual report
Please find page 33 of the 2010 Nordstrom annual report below. You can navigate through the pages in the report by either clicking on the pages listed below, or by using the keyword search tool below to find specific information within the annual report.-
 1
1 -
2
-
3
-
4
-
5
-
6
-
7
-
8
-
9
-
10
-
11
-
12
-
13
-
14
-
15
-
16
-
17
-
18
-
19
-
20
-
21
-
22
-
 23
23 -
 24
24 -
 25
25 -
 26
26 -
 27
27 -
 28
28 -
 29
29 -
 30
30 -
 31
31 -
 32
32 -
 33
33 -
 34
34 -
 35
35 -
 36
36 -
 37
37 -
 38
38 -
 39
39 -
 40
40 -
 41
41 -
 42
42 -
 43
43 -
44
-
45
-
46
-
47
-
48
-
49
-
50
-
51
-
52
-
53
-
54
-
55
-
56
-
57
-
58
-
59
-
60
-
61
-
62
-
63
-
64
-
65
-
66
-
67
-
68
-
69
-
70
-
71
-
72
-
73
-
74
-
75
-
76
-
77
-
78
-
79
-
80
-
81
-
82
-
83
-
84
-
85
-
86
-
87
-
88
 |
 |

Nordstrom, Inc. and subsidiaries 25
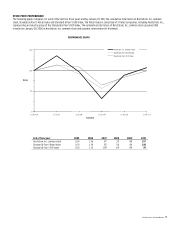
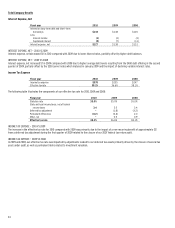
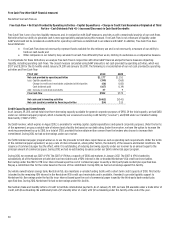
Fourth Quarter Results
Quarter ended January 29, 2011 January 30, 2010
Net sales $2,816
$2,539
Credit card revenues 100 101
Gross profit 1,058 946
Selling, general and administrative (“SG&A”) expenses:
Retail (697) (631)
Credit (55) (106)
Net earnings 232 172
Earnings per diluted share $1.04 $0.77
% of net sales:
Gross profit 37.6% 37.3%
Retail SG&A 24.8% 24.9%
Our fourth quarter performance reflected continued improvement in our sales and gross margin trends throughout the year. Net earnings for the
fourth quarter of 2010 were $232, or $1.04 per diluted share compared with $172, or $0.77 per diluted share in 2009.
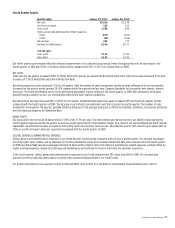
NET SALES
Total sales for the quarter increased 10.9% to $2,816. During the quarter, we opened one Nordstrom Rack store. Same-store sales increased 6.7%, with
increases of 7.2% at Nordstrom and 3.9% at Nordstrom Rack.
Nordstrom same-store sales increased 7.2% for the quarter. Both the number of sales transactions and the average selling price of our merchandise
increased for the quarter ended January 29, 2011 compared with the same period last year. Category highlights for the quarter were jewelry, dresses
and shoes. The South and Midwest were the top-performing geographic regions relative to the fourth quarter of 2009. We continued to drive sales
growth through customer service, our merchandise offering and multi-channel capabilities.
Nordstrom Rack net sales increased $93, or 24.1% for the quarter. Nordstrom Rack same-store sales increased 3.9% for the fourth quarter of 2010
compared with the fourth quarter of 2009. The increase in part reflects a promotional event that occurred during the quarter. The number of sales
transactions increased for the quarter, partially offset by decreases in the average selling price of Rack merchandise. Cosmetics, accessories and shoes
were the leading categories for Nordstrom Rack.
GROSS PROFIT
Our gross profit rate increased 34 basis points to 37.6% from 37.3% last year. The improvement was mainly driven by our ability to leverage buying
and occupancy expenses during the quarter as well as a slight improvement in merchandise margin. As a result of our merchandising and multi-channel
capabilities, we achieved increases in regular-priced selling and in our inventory turnover rate. We ended the quarter with inventory per square foot up
3.8% on a 6.0% increase in sales per square foot compared with the fourth quarter of 2009.
SELLING, GENERAL & ADMINISTRATIVE EXPENSES
Selling, general and administrative expenses for our Retail Business increased $66 compared with last year’s fourth quarter. The increase was largely
driven by higher sales volume, and by expenses for the three Nordstrom stores and seventeen Nordstrom Rack stores opened since the fourth quarter
of 2009. Our Retail SG&A rate decreased approximately 10 basis points primarily due to the timing of performance-related expenses, partially offset by
higher overhead expenses related to technology and marketing as we continued to invest in improving the customer experience.
In the fourth quarter, selling, general and administrative expenses for our Credit segment were $55, down from $106 in 2009. The decrease was
primarily driven by lower bad debt expense resulting from continued improvements in our credit trends.
For further information on our quarterly results in 2010 and 2009, refer to Note 15 in the Notes to Consolidated Financial Statements in Item 8.