Nordstrom 2010 Annual Report Download - page 66
Download and view the complete annual report
Please find page 66 of the 2010 Nordstrom annual report below. You can navigate through the pages in the report by either clicking on the pages listed below, or by using the keyword search tool below to find specific information within the annual report.-
 1
1 -
2
-
3
-
4
-
5
-
6
-
7
-
8
-
9
-
10
-
11
-
12
-
13
-
14
-
15
-
16
-
17
-
18
-
19
-
20
-
21
-
22
-
23
-
24
-
25
-
26
-
27
-
28
-
29
-
30
-
31
-
32
-
33
-
34
-
35
-
36
-
37
-
38
-
39
-
40
-
41
-
42
-
43
-
44
-
45
-
46
-
47
-
48
-
49
-
50
-
51
-
52
-
53
-
54
-
55
-
 56
56 -
 57
57 -
 58
58 -
 59
59 -
 60
60 -
 61
61 -
 62
62 -
 63
63 -
 64
64 -
 65
65 -
 66
66 -
 67
67 -
 68
68 -
 69
69 -
 70
70 -
 71
71 -
 72
72 -
 73
73 -
 74
74 -
 75
75 -
 76
76 -
77
-
78
-
79
-
80
-
81
-
82
-
83
-
84
-
85
-
86
-
87
-
88
 |
 |

58
Nordstrom, Inc.
Notes to Consolidated Financial Statements
Dollar and share amounts in millions except per share, per option and unit amounts
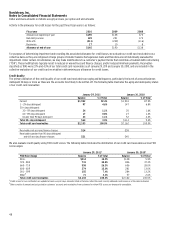
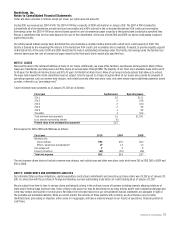
NOTE 13: EARNINGS PER SHARE
Earnings per basic share is computed using the weighted average number of common shares outstanding during the year. Earnings per diluted share
uses the weighted average number of common shares outstanding during the year plus dilutive common stock equivalents, primarily stock options.
The computation of earnings per share is as follows:
Options and other equity instruments totaling 6.1 shares in 2010, 7.2 shares in 2009 and 4.9 shares in 2008 were excluded from earnings per diluted
share because their impact was anti-dilutive.
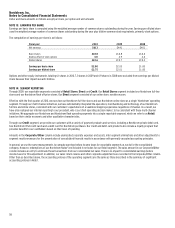
NOTE 14: SEGMENT REPORTING
Through 2009, our reportable segments consisted of Retail Stores, Direct and Credit. Our Retail Stores segment included our Nordstrom full-line
stores and our Nordstrom Rack off-price stores. Our Direct segment consisted of our online store, nordstrom.com.
Effective with the first quarter of 2010, we now view our Nordstrom full-line stores and our Nordstrom online store as a single ‘Nordstrom’ operating
segment. Through our multi-channel initiatives, we have substantially integrated the operations, merchandising and technology of our Nordstrom
full-line and online stores, consistent with our customers’ expectations of a seamless shopping experience regardless of channel. As a result, we
have also realigned our internal reporting to our president, who is our chief operating decision maker, to be consistent with these multi-channel
initiatives. We aggregate our Nordstrom and Nordstrom Rack operating segments into a single reportable segment, which we refer to as Retail,
based on their similar economic and other qualitative characteristics.
Through our Credit segment, we provide our customers with a variety of payment products and services, including a Nordstrom private label card,
two Nordstrom VISA credit cards and a debit card for Nordstrom purchases. Our credit and debit card products also include a loyalty program that
provides benefits to our cardholders based on their level of spending.
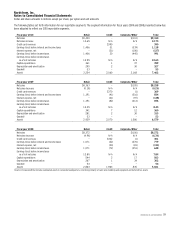
Amounts in the Corporate/Other column include unallocated corporate expenses and assets, inter-segment eliminations and other adjustments to
segment results necessary for the presentation of consolidated financial results in accordance with generally accepted accounting principles.
In general, we use the same measurements to compute earnings before income taxes for reportable segments as we do for the consolidated
company. However, redemptions of our Nordstrom Notes® are included in net sales for our Retail segment. The sales amount in our Corporate/Other
column includes an entry to eliminate these transactions from our consolidated net sales. There is no impact to consolidated earnings before
income taxes for this adjustment. In addition, our sales return reserve and other corporate adjustments are recorded in the Corporate/Other column.
Other than as described above, the accounting policies of the operating segments are the same as those described in the summary of significant
accounting policies in Note 1.
Fiscal year 2010 2009 2008
Net earnings $613 $441 $401
Basic shares 218.8 216.8 216.6
Dilutive effect of stock options 3.8 2.9 2.6
Diluted shares 222.6 219.7 219.2
Earnings per basic share $2.80 $2.03 $1.85
Earnings per diluted share $2.75 $2.01 $1.83