Nordstrom 2010 Annual Report Download - page 30
Download and view the complete annual report
Please find page 30 of the 2010 Nordstrom annual report below. You can navigate through the pages in the report by either clicking on the pages listed below, or by using the keyword search tool below to find specific information within the annual report.-
 1
1 -
2
-
3
-
4
-
5
-
6
-
7
-
8
-
9
-
10
-
11
-
12
-
13
-
14
-
15
-
16
-
17
-
18
-
19
-
 20
20 -
 21
21 -
 22
22 -
 23
23 -
 24
24 -
 25
25 -
 26
26 -
 27
27 -
 28
28 -
 29
29 -
 30
30 -
 31
31 -
 32
32 -
 33
33 -
 34
34 -
 35
35 -
 36
36 -
 37
37 -
 38
38 -
 39
39 -
 40
40 -
41
-
42
-
43
-
44
-
45
-
46
-
47
-
48
-
49
-
50
-
51
-
52
-
53
-
54
-
55
-
56
-
57
-
58
-
59
-
60
-
61
-
62
-
63
-
64
-
65
-
66
-
67
-
68
-
69
-
70
-
71
-
72
-
73
-
74
-
75
-
76
-
77
-
78
-
79
-
80
-
81
-
82
-
83
-
84
-
85
-
86
-
87
-
88
 |
 |

22
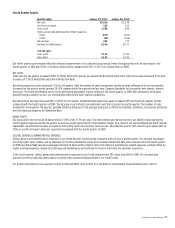
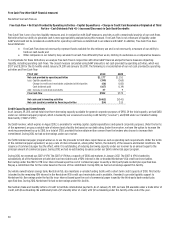
Credit Card Revenues
Credit card revenues include finance charges, interchange fees, late fees and other fees. Finance charges represent interest earned on unpaid balances
while late fees are assessed when cardholders pay less than their minimum balance by the payment due date. Interchange fees are earned from the
use of Nordstrom VISA credit cards at merchants outside of Nordstrom.
CREDIT CARD REVENUES — 2010 VS 2009
Credit card revenues increased $20 in 2010 compared with 2009 primarily due to higher late fees, particularly in the first half of the year. As the year
progressed, improving economic conditions led to an increase in general consumer spending, improved payment rates, lower revolving balances and
reduced delinquencies. Our average credit card receivable balance in 2010 was $2,088, a decrease of $11, or 0.5%, from 2009.
Slightly higher average annual percentage rates, partially offset by lower revolving balances from improvements in customer payment rates, resulted
in a small increase in finance charges to $266, or 12.7% of average credit card receivables in 2010 compared with $264, or 12.6% of average credit card
receivables in 2009.Increased use of our Nordstrom VISA credit cards at third parties resulted in an increase in interchange revenue to $76, or 3.7% of
average credit card receivables in 2010 compared with $71, or 3.4% of average credit card receivables in 2009. Delinquencies increased during the first
half of 2010 compared with the first half of 2009. Additionally, legal and regulatory changes in 2009 and 2010 affected our pricing and billing terms.
Taken together, these factors resulted in an increase in late fees and other revenue to $48, or 2.3% of average credit card receivables in 2010
compared with $35, or 1.7% of average receivables in 2009.
CREDIT CARD REVENUES — 2009 VS 2008
Credit card revenues increased to $370 in 2009 compared with $302 in 2008 due primarily to higher finance charges and late fees. Worsening economic
conditions led to a decline in general consumer spending, reduced payment rates, increased revolving balances and increased delinquencies. Our
average credit card receivable balance in 2009 was $2,099, an increase of $188, or 9.8%, over 2008.
Increased revolving balances, combined with an increase in our annual percentage rate terms implemented in the fourth quarter of 2008, resulted in an
increase in finance charges to $264, or 12.6% of average credit card receivables in 2009. This compared with $215, or 11.3% of average credit card
receivables in 2008. Increased delinquencies resulted in an increase in late fees and other revenue to $35, or 1.7% of average credit card receivables in
2009, compared with $18, or 0.9% of average credit card receivables in 2008.
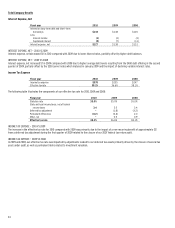
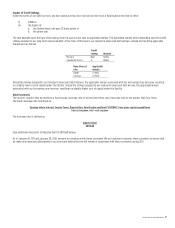
Credit Segment Interest Expense
Interest expense decreased to $21 in 2010 from $41 in 2009 and $50 in 2008. These year-over-year decreases were due to lower interest rates.
Credit Segment Cost of Sales and Related Buying and Occupancy Costs
Cost of sales and related buying and occupancy costs, which includes the estimated cost of Nordstrom Notes that will be issued and redeemed under
our Fashion Rewards program, increased to $66 in 2010 compared with $55 in 2009 and $50 in 2008. The increases were due to a higher number of
Fashion Rewards customers, larger average spend per customer, increased inside volume and increased utilization of program benefits. We provide
these benefits to our customers as participation in the Fashion Rewards program generates enhanced customer loyalty and incremental sales in
our stores.
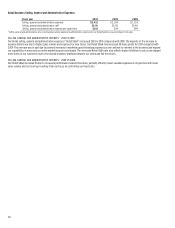
Credit Segment Selling, General and Administrative Expenses
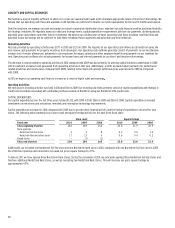
Selling, general and administrative expenses for our Credit segment (“Credit SG&A”) are made up of operational and marketing expenses, and bad debt.
These expenses are summarized in the following table:
Fiscal year 2010 2009 2008
Operational and marketing expenses $124 $105 $101
Bad debt expense 149 251 173
Total selling, general and administrative expenses $273 $356 $274
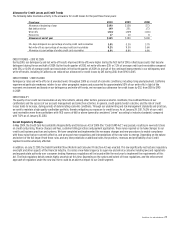
SELLING, GENERAL AND ADMINISTRATIVE EXPENSES — 2010 VS 2009
Total Credit SG&A decreased $83 in 2010 compared with 2009, due primarily to lower bad debt expense, partially offset by increases in operational and
marketing expenses. The decrease in bad debt expense reflects continued improvement in our credit trends which are further discussed below.
Operational and marketing expenses are incurred to support and service our credit and debit card products and the related rewards programs. The
increase in these expenses in 2010 was primarily driven by increased information technology expenses, higher collection agency fees from increased
recovery efforts and expenses related to our Fashion Rewards program.
SELLING, GENERAL AND ADMINISTRATIVE EXPENSES — 2009 VS 2008
Total Credit SG&A increased $82 in 2009 compared with 2008 due primarily to increased bad debt expense. The increase in bad debt expense reflects
higher write-offs due to consumer credit trends which are further discussed below.