Nordstrom 2010 Annual Report Download - page 43
Download and view the complete annual report
Please find page 43 of the 2010 Nordstrom annual report below. You can navigate through the pages in the report by either clicking on the pages listed below, or by using the keyword search tool below to find specific information within the annual report.-
 1
1 -
2
-
3
-
4
-
5
-
6
-
7
-
8
-
9
-
10
-
11
-
12
-
13
-
14
-
15
-
16
-
17
-
18
-
19
-
20
-
21
-
22
-
23
-
24
-
25
-
26
-
27
-
28
-
29
-
30
-
31
-
32
-
 33
33 -
 34
34 -
 35
35 -
 36
36 -
 37
37 -
 38
38 -
 39
39 -
 40
40 -
 41
41 -
 42
42 -
 43
43 -
 44
44 -
 45
45 -
 46
46 -
 47
47 -
 48
48 -
 49
49 -
 50
50 -
 51
51 -
 52
52 -
 53
53 -
54
-
55
-
56
-
57
-
58
-
59
-
60
-
61
-
62
-
63
-
64
-
65
-
66
-
67
-
68
-
69
-
70
-
71
-
72
-
73
-
74
-
75
-
76
-
77
-
78
-
79
-
80
-
81
-
82
-
83
-
84
-
85
-
86
-
87
-
88
 |
 |

Nordstrom, Inc. and subsidiaries 35
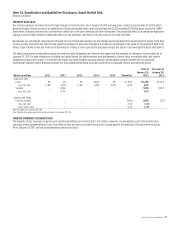
Item 7A. Quantitative and Qualitative Disclosures About Market Risk.
Dollars in millions
INTEREST RATE RISK
Our primary exposure to market risk is through changes in interest rates. As of January 29, 2011, we have gross credit card receivables of $2,103, which
generate finance charge income at a combination of fixed and variable rates, and long-term debt of $2,781, including $1,150 that bears interest at LIBOR-
based rates. Changing interest rates can therefore affect our credit card revenues and interest expense. The annualized effect of a one-percentage-point
change in interest rates would not materially affect our net earnings, cash flows or the fair value of our fixed-rate debt.
We manage our net interest rate exposure through our mix of fixed and variable rate borrowings and associated current and long-term assets. From time
to time, we may also enter into interest rate swap transactions for purposes of hedging the exposure of changes in fair value of our long-term debt from
interest rate risk. We do not use financial instruments for trading or other speculative purposes and are not party to any leveraged financial instruments.
The table below presents information about our long-term debt obligations and interest rate swaps that are sensitive to changes in interest rates as of
January 29, 2011. For debt obligations, including our capital leases, the table presents principal amounts, at book value, by maturity date, and related
weighted average interest rates. For interest rate swaps, the table presents notional amounts and weighted average interest rates by expected
(contractual) maturity dates. Notional amounts are the predetermined dollar principal on which the exchanged interest payments are based.
Dollars in millions
2011
2012
2013
2014
2015
Thereafter
Total at
January 29,
2011
Fair value at
January 29,
2011
Long-term debt
Fixed $6 $6 $7 $406 $8 $1,823 $2,256 $2,513
Avg. int. rate 8.8% 8.5% 8.4% 6.8% 8.5% 6.2% 6.3%
Variable — $500 – — — — $500 $497
Avg. int. rate1 — 0.3% – — — — 0.3%
Interest rate swaps
Fixed to variable — — — — — $650 $650 $252
Avg. pay rate1 — — — — — 3.1% 3.1%
Avg. receive rate — — — — — 6.3% 6.3%
1Interest rates as of January 29, 2011.
2Our interest rate swaps were in an asset position as of January 29, 2011.
FOREIGN CURRENCY EXCHANGE RISK
The majority of our revenues, expenses and capital expenditures are transacted in U.S. dollars. However, we periodically enter into merchandise
purchase orders denominated in Euros. From time to time we may use forward contracts to hedge against fluctuations in foreign currency prices.
As of January 29, 2011, we had no outstanding forward contracts.