Nordstrom 2010 Annual Report Download - page 24
Download and view the complete annual report
Please find page 24 of the 2010 Nordstrom annual report below. You can navigate through the pages in the report by either clicking on the pages listed below, or by using the keyword search tool below to find specific information within the annual report.-
 1
1 -
2
-
3
-
4
-
5
-
6
-
7
-
8
-
9
-
10
-
11
-
12
-
13
-
 14
14 -
 15
15 -
 16
16 -
 17
17 -
 18
18 -
 19
19 -
 20
20 -
 21
21 -
 22
22 -
 23
23 -
 24
24 -
 25
25 -
 26
26 -
 27
27 -
 28
28 -
 29
29 -
 30
30 -
 31
31 -
 32
32 -
 33
33 -
 34
34 -
35
-
36
-
37
-
38
-
39
-
40
-
41
-
42
-
43
-
44
-
45
-
46
-
47
-
48
-
49
-
50
-
51
-
52
-
53
-
54
-
55
-
56
-
57
-
58
-
59
-
60
-
61
-
62
-
63
-
64
-
65
-
66
-
67
-
68
-
69
-
70
-
71
-
72
-
73
-
74
-
75
-
76
-
77
-
78
-
79
-
80
-
81
-
82
-
83
-
84
-
85
-
86
-
87
-
88
 |
 |

16
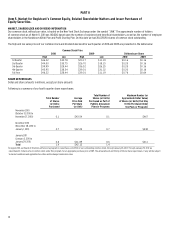
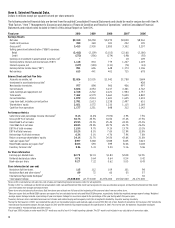
Item 6. Selected Financial Data.
Dollars in millions except per square foot and per share amounts
The following selected financial data are derived from the audited Consolidated Financial Statements and should be read in conjunction with Item 1A
“Risk Factors,” Item 7 “Management’s Discussion and Analysis of Financial Condition and Results of Operations,” and the Consolidated Financial
Statements and related notes included in Item 8 of this Annual Report on Form 10-K.
Fiscal year 2010 2009 2008 20076 20067
Earnings Results
Net sales $9,310 $8,258 $8,272 $8,828 $8,561
Credit card revenues 390 369 301 252 105
Gross profit1 3,413 2,930 2,855 3,302 3,207
Selling, general and administrative (“SG&A”) expenses:
Retail (2,412) (2,109) (2,103) (2,161) (2,180)
Credit (273) (356) (274) (198) (92)
Earnings on investment in asset-backed securities, net2 - - - 18 109
Earnings before interest and income taxes (“EBIT”) 1,118 834 779 1,247 1,149
Interest expense, net (127) (138) (131) (74) (43)
Earnings before income taxes (“EBT”) 991 696 648 1,173 1,106
Net earnings 613 441 401 715 678
Balance Sheet and Cash Flow Data
Accounts receivable, net $2,026 $2,035 $1,942 $1,788 $684
Investment in asset-backed securities2 - - - - 428
Merchandise inventories 977 898 900 956 997
Current assets 4,824 4,054 3,217 3,361 2,742
Land, buildings and equipment, net 2,318 2,242 2,221 1,983 1,757
Total assets 7,462 6,579 5,661 5,600 4,822
Current liabilities 1,879 2,014 1,601 1,635 1,433
Long-term debt, including current portion 2,781 2,613 2,238 2,497 631
Shareholders’ equity 2,021 1,572 1,210 1,115 2,169
Cash flow from operations 1,177 1,251 848 312 1,142
Performance Metrics
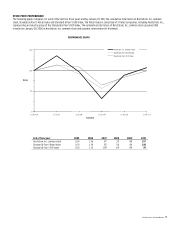
Same-store sales percentage increase (decrease)3 8.1% (4.2%) (9.0%) 3.9% 7.5%
Gross profit % of net sales 36.7% 35.5% 34.5% 37.4% 37.5%
Retail SG&A % of net sales 25.9% 25.5% 25.4% 24.5% 25.5%
Total SG&A % of net sales 28.8% 29.8% 28.7% 26.7% 26.5%
EBIT % of total revenues 11.5% 9.7% 9.1% 13.7% 13.3%
EBT % of total revenues 10.2% 8.1% 7.6% 12.9% 12.8%
Net earnings % of total revenues 6.3% 5.1% 4.7% 7.9% 7.8%
Return on average shareholders’ equity 34.1% 31.7% 34.5% 43.6% 31.8%
Sales per square foot4 $397 $368 $388 $435 $423
Retail SG&A expense per square foot4 $103 $94 $99 $106 $108
Inventory turnover rate5 5.56 5.41 5.20 5.16 5.06
Per Share Information
Earnings per diluted share $2.75 $2.01 $1.83 $2.88 $2.55
Dividends declared per share 0.76 0.64 0.64 0.54 0.42
Book value per share 9.27 7.22 5.62 5.05 8.43
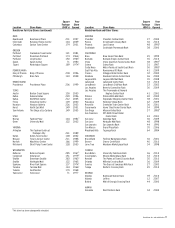
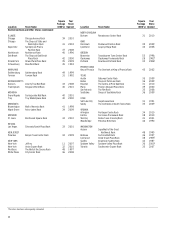
Store Information (at year end)
Nordstrom full-line stores 115 112 109 101 98
Nordstrom Rack and other stores6 89 72 60 55 57
International Façonnable boutiques6 - - - - 36
Total square footage 23,838,000 22,773,000 21,876,000 20,502,000 20,170,000
1Gross profit is calculated as net sales less cost of sales and related buying and occupancy costs (for all segments).
2On May 1, 2007, we combined our Nordstrom private label credit card and Nordstrom VISA credit card programs into one securitization program. At that time the Nordstrom VISA credit
card receivables were brought on-balance sheet.
3Same-store sales include sales from stores that have been open at least one full year at the beginning of the year and sales from our online store.
4Sales per square foot and Retail SG&A expense per square foot are calculated as net sales and Retail SG&A expense, respectively, divided by weighted average square footage. Weighted
average square footage includes a percentage of year-end square footage for new stores equal to the percentage of the year during which they were open.
5Inventory turnover rate is calculated as annual cost of sales and related buying and occupancy costs (for all segments) divided by 4-quarter average inventory.
6During the third quarter of 2007, we completed the sale of our Façonnable business and realized a gain on sale of $34 ($21, net of tax). Results of operations for fiscal year 2007 include the
international Façonnable boutiques through August 31, 2007 and the domestic Façonnable boutiques through October 31, 2007. Prior to the sale, the domestic Façonnable boutiques
were included in “Nordstrom Rack and other stores.”
7Fiscal year 2006 includes an extra week (the 53rd week) as a result of our 4-5-4 retail reporting calendar. The 53rd week is not included in our calculation of same-store sales.