Nordstrom 2010 Annual Report Download - page 26
Download and view the complete annual report
Please find page 26 of the 2010 Nordstrom annual report below. You can navigate through the pages in the report by either clicking on the pages listed below, or by using the keyword search tool below to find specific information within the annual report.-
 1
1 -
2
-
3
-
4
-
5
-
6
-
7
-
8
-
9
-
10
-
11
-
12
-
13
-
14
-
15
-
 16
16 -
 17
17 -
 18
18 -
 19
19 -
 20
20 -
 21
21 -
 22
22 -
 23
23 -
 24
24 -
 25
25 -
 26
26 -
 27
27 -
 28
28 -
 29
29 -
 30
30 -
 31
31 -
 32
32 -
 33
33 -
 34
34 -
 35
35 -
 36
36 -
37
-
38
-
39
-
40
-
41
-
42
-
43
-
44
-
45
-
46
-
47
-
48
-
49
-
50
-
51
-
52
-
53
-
54
-
55
-
56
-
57
-
58
-
59
-
60
-
61
-
62
-
63
-
64
-
65
-
66
-
67
-
68
-
69
-
70
-
71
-
72
-
73
-
74
-
75
-
76
-
77
-
78
-
79
-
80
-
81
-
82
-
83
-
84
-
85
-
86
-
87
-
88
 |
 |

18
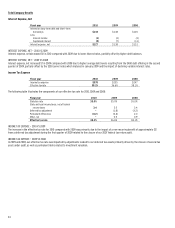
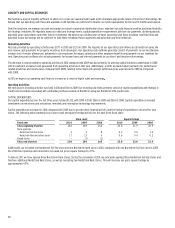
Retail Business
Summary
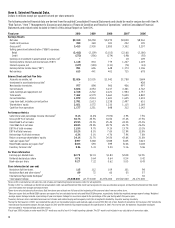
The following table summarizes the results of our Retail Business for the fiscal years ended January 29, 2011, January 30, 2010 and January 31, 2009:
Fiscal year 2010 2009 2008
Amount
% of net
sales
Amount
% of net
sales
Amount
% of net
sales
Net sales $9,310
100.0% $8,258 100.0% $8,272 100.0%
Cost of sales and related buying and occupancy costs (5,831) (62.6%) (5,273) (63.9%) (5,367) (64.9%)
Gross profit 3,479 37.4% 2,985 36.1% 2,905 35.1%
Other revenues – N/A (1) N/A (1) N/A
Selling, general and administrative expenses (2,412) (25.9%) (2,109) (25.5%) (2,103) (25.4%)
Earnings before interest and income taxes 1,067 11.5% 875 10.6% 801 9.7%
Retail Business Net Sales
Fiscal year 2010 20091 20081
Net sales by channel:
Nordstrom full-line stores $6,995 $6,360 $6,630
Direct 705 563 501
Nordstrom 7,700 6,923 7,131
Nordstrom Rack and other 1,720 1,440 1,241
Total Retail segment sales 9,420 8,363 8,372
Corporate/Other (110) (105) (100)
Total $9,310 $8,258 $8,272
Net sales increase (decrease) 12.7% (0.2%) (6.3%)
Same-store sales increase (decrease) by channel:
Nordstrom full-line stores 7.9% (7.2%) (12.4%)
Direct 25.1% 14.5% 8.4%
Nordstrom 9.3% (5.0%) (10.6%)
Nordstrom Rack and other 0.7% 2.5% 3.1%
Total 8.1% (4.2%) (9.0%)
Sales per square foot $397 $368 $388
Percentage of net sales by merchandise category:
Women’s apparel 34% 34% 34%
Shoes 23% 22% 21%
Men’s apparel 15% 15% 16%
Women’s accessories 12% 12% 12%
Cosmetics 10% 11% 11%
Children’s apparel 3% 3% 3%
Other 3% 3% 3%
Total 100% 100% 100%
1Prior to February 2010, merchandise purchased from our online store that was later returned to our Nordstrom full-line stores was reported as a deduction from Nordstrom full-line store
sales. Beginning in February 2010, we now deduct these returns from Direct sales instead of from Nordstrom full-line store sales in order to better align sales and sales returns within each
channel. For purposes of comparison, 2009 and 2008 net sales results for both Nordstrom full-line stores and Direct have been revised to reflect this realignment of returns. This
realignment of sales returns between channels had no effect on total Retail segment sales.
NET SALES — 2010 VS 2009
Net sales for 2010 increased 12.7% compared with 2009. During the year, we opened three Nordstrom full-line stores, relocated one Nordstrom full-line
store, opened seventeen Nordstrom Rack stores and relocated one Nordstrom Rack store. These stores represented 3.3% of our total net sales for
2010, and increased our gross square footage by 4.7%. Same-store sales increased 8.1%, with increases of 9.3% at Nordstrom and 0.7% at
Nordstrom Rack.