Nordstrom 2010 Annual Report Download - page 50
Download and view the complete annual report
Please find page 50 of the 2010 Nordstrom annual report below. You can navigate through the pages in the report by either clicking on the pages listed below, or by using the keyword search tool below to find specific information within the annual report.-
 1
1 -
2
-
3
-
4
-
5
-
6
-
7
-
8
-
9
-
10
-
11
-
12
-
13
-
14
-
15
-
16
-
17
-
18
-
19
-
20
-
21
-
22
-
23
-
24
-
25
-
26
-
27
-
28
-
29
-
30
-
31
-
32
-
33
-
34
-
35
-
36
-
37
-
38
-
39
-
 40
40 -
 41
41 -
 42
42 -
 43
43 -
 44
44 -
 45
45 -
 46
46 -
 47
47 -
 48
48 -
 49
49 -
 50
50 -
 51
51 -
 52
52 -
 53
53 -
 54
54 -
 55
55 -
 56
56 -
 57
57 -
 58
58 -
 59
59 -
 60
60 -
61
-
62
-
63
-
64
-
65
-
66
-
67
-
68
-
69
-
70
-
71
-
72
-
73
-
74
-
75
-
76
-
77
-
78
-
79
-
80
-
81
-
82
-
83
-
84
-
85
-
86
-
87
-
88
 |
 |

42
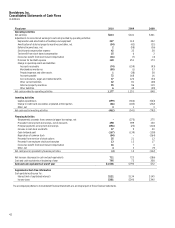
Nordstrom, Inc.
Consolidated Statements of Cash Flows
In millions
Fiscal year 2010 2009 2008
Operating Activities
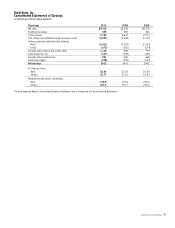
Net earnings $613 $441 $401
Adjustments to reconcile net earnings to net cash provided by operating activities:
Depreciation and amortization of buildings and equipment 327 313 302
Amortization of deferred property incentives and other, net (54) (42) (21)
Deferred income taxes, net 2 (58) (36)
Stock-based compensation expense 42 32 28
Tax benefit from stock-based compensation 15 6 3
Excess tax benefit from stock-based compensation (16) (7) (4)
Provision for bad debt expense 149 251 173
Change in operating assets and liabilities:
Accounts receivable (74) (159) (93)
Merchandise inventories (80) (1) 53
Prepaid expenses and other assets 1 (38) 38
Accounts payable 72 168 16
Accrued salaries, wages and related benefits 37 120 (54)
Other current liabilities 42 81 (48)
Deferred property incentives 95 96 119
Other liabilities 6 48 (29)
Net cash provided by operating activities 1,177 1,251 848
Investing Activities
Capital expenditures (399) (360) (563)
Change in credit card receivables originated at third parties (66) (182) (232)
Other, net 3 1 3
Net cash used in investing activities (462) (541) (792)
Financing Activities
(Repayments) proceeds from commercial paper borrowings, net – (275) 275
Proceeds from long-term borrowings, net of discounts 498 399 150
Principal payments on long-term borrowings (356) (25) (410)
Increase in cash book overdrafts 37 9 20
Cash dividends paid (167) (139) (138)
Repurchase of common stock (84) — (264)
Proceeds from exercise of stock options 35 21 13
Proceeds from employee stock purchase plan 13 13 17
Excess tax benefit from stock-based compensation 16 7 4
Other, net 4 3 (9)
Net cash (used in) provided by financing activities (4) 13 (342)
Net increase (decrease) in cash and cash equivalents 711 723 (286)
Cash and cash equivalents at beginning of year 795 72 358
Cash and cash equivalents at end of year $1,506 $795 $72
Supplemental Cash Flow Information
Cash paid during the year for:
Interest (net of capitalized interest) $121 $134 $145
Income taxes $381 $240 $340
The accompanying Notes to Consolidated Financial Statements are an integral part of these financial statements.