Nordstrom 2010 Annual Report Download - page 23
Download and view the complete annual report
Please find page 23 of the 2010 Nordstrom annual report below. You can navigate through the pages in the report by either clicking on the pages listed below, or by using the keyword search tool below to find specific information within the annual report.-
 1
1 -
2
-
3
-
4
-
5
-
6
-
7
-
8
-
9
-
10
-
11
-
12
-
 13
13 -
 14
14 -
 15
15 -
 16
16 -
 17
17 -
 18
18 -
 19
19 -
 20
20 -
 21
21 -
 22
22 -
 23
23 -
 24
24 -
 25
25 -
 26
26 -
 27
27 -
 28
28 -
 29
29 -
 30
30 -
 31
31 -
 32
32 -
 33
33 -
34
-
35
-
36
-
37
-
38
-
39
-
40
-
41
-
42
-
43
-
44
-
45
-
46
-
47
-
48
-
49
-
50
-
51
-
52
-
53
-
54
-
55
-
56
-
57
-
58
-
59
-
60
-
61
-
62
-
63
-
64
-
65
-
66
-
67
-
68
-
69
-
70
-
71
-
72
-
73
-
74
-
75
-
76
-
77
-
78
-
79
-
80
-
81
-
82
-
83
-
84
-
85
-
86
-
87
-
88
 |
 |
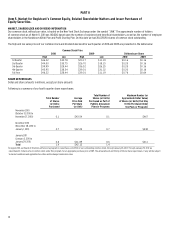
Nordstrom, Inc. and subsidiaries 15
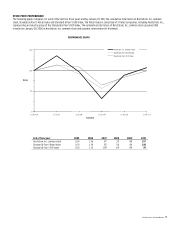
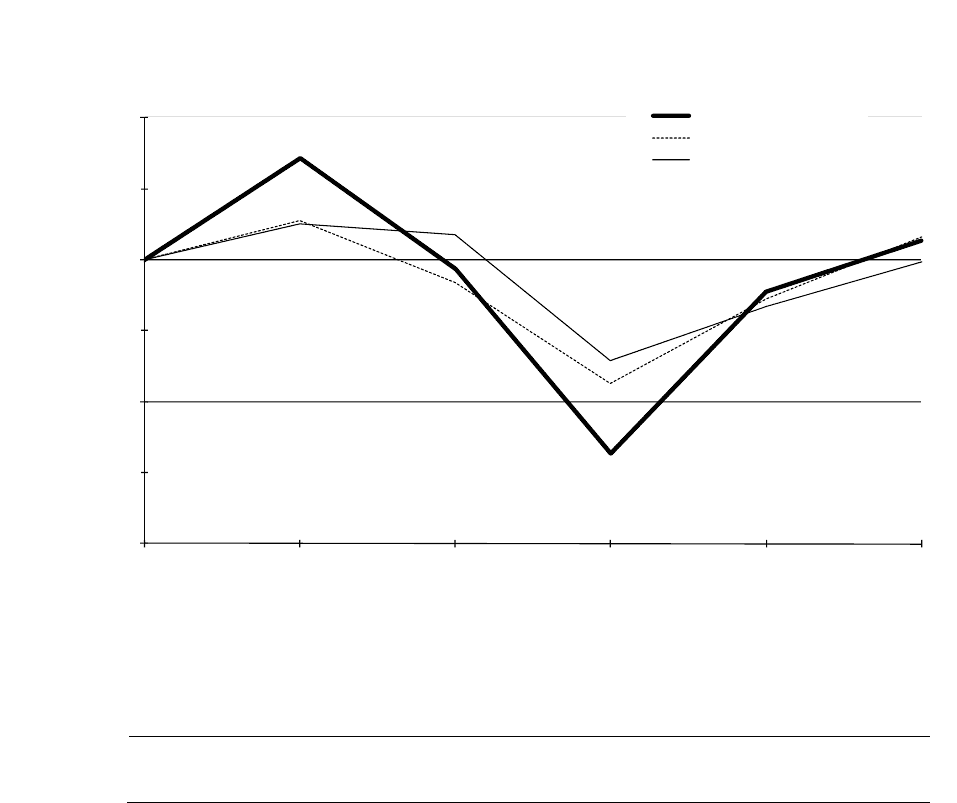
STOCK PRICE PERFORMANCE
The following graph compares, for each of the last five fiscal years ending January 29, 2011, the cumulative total return of Nordstrom, Inc. common
stock, Standard & Poor’s Retail Index and Standard & Poor’s 500 Index. The Retail Index is comprised of 31 retail companies, including Nordstrom, Inc.,
representing an industry group of the Standard & Poor’s 500 Index. The cumulative total return of Nordstrom, Inc. common stock assumes $100
invested on January 28, 2006 in Nordstrom, Inc. common stock and assumes reinvestment of dividends.
End of fiscal year 2005 2006 2007 2008 2009 2010
Nordstrom, Inc. common stock 100 136 97 32 89 107
Standard & Poor’s Retail Index 100 114 92 56 86 108
Standard & Poor’s 500 Index 100 113 109 64 84 99
0
50
100
150
1/28/06 2/3/07 2/2/08 1/31/09 1/30/10 1/29/11
Dollars
Year Ended
PERFORMANCE GRAPH
Nordstrom, Inc. Common Stock
Standard & Poor's Retail Index
Standard & Poor's 500 Index