Nordstrom 2010 Annual Report Download - page 32
Download and view the complete annual report
Please find page 32 of the 2010 Nordstrom annual report below. You can navigate through the pages in the report by either clicking on the pages listed below, or by using the keyword search tool below to find specific information within the annual report.-
 1
1 -
2
-
3
-
4
-
5
-
6
-
7
-
8
-
9
-
10
-
11
-
12
-
13
-
14
-
15
-
16
-
17
-
18
-
19
-
20
-
21
-
 22
22 -
 23
23 -
 24
24 -
 25
25 -
 26
26 -
 27
27 -
 28
28 -
 29
29 -
 30
30 -
 31
31 -
 32
32 -
 33
33 -
 34
34 -
 35
35 -
 36
36 -
 37
37 -
 38
38 -
 39
39 -
 40
40 -
 41
41 -
 42
42 -
43
-
44
-
45
-
46
-
47
-
48
-
49
-
50
-
51
-
52
-
53
-
54
-
55
-
56
-
57
-
58
-
59
-
60
-
61
-
62
-
63
-
64
-
65
-
66
-
67
-
68
-
69
-
70
-
71
-
72
-
73
-
74
-
75
-
76
-
77
-
78
-
79
-
80
-
81
-
82
-
83
-
84
-
85
-
86
-
87
-
88
 |
 |

24
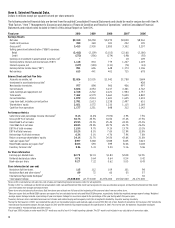
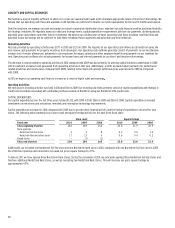
Total Company Results
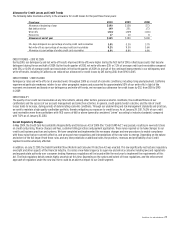
Interest Expense, Net
Fiscal year 2010 2009 2008
Interest on long-term debt and short-term
borrowings $133 $148 $145
Less:
Interest income (1) (3) (3)
Capitalized interest (5) (7) (11)
Interest expense, net $127 $138 $131
INTEREST EXPENSE, NET — 2010 VS 2009
Interest expense, net decreased $11 in 2010 compared with 2009 due to lower interest rates, partially offset by higher debt balances.
INTEREST EXPENSE, NET — 2009 VS 2008
Interest expense, net increased $7 in 2009 compared with 2008 due to higher average debt levels resulting from the $400 debt offering in the second
quarter of 2009, partially offset by the $250 senior notes which matured in January 2009 and the impact of declining variable interest rates.
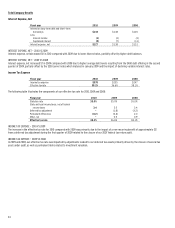
Income Tax Expense
Fiscal year 2010 2009 2008
Income tax expense $378 $255 $247
Effective tax rate 38.2% 36.6% 38.1%
The following table illustrates the components of our effective tax rate for 2010, 2009 and 2008:
Fiscal year 2010 2009 2008
Statutory rate 35.0% 35.0% 35.0%
State and local income taxes, net of federal
income taxes 3.4 3.5 3.4
Deferred tax adjustment – (1.8) (3.2)
Permanent differences (0.2) (0.6) 2.0
Other, net – 0.5 0.9
Effective tax rate 38.2% 36.6% 38.1%
INCOME TAX EXPENSE — 2010 VS 2009
The increase in the effective tax rate for 2010 compared with 2009 was primarily due to the impact of a non-recurring benefit of approximately $12
from a deferred tax adjustment during the first quarter of 2009 related to the closure of our 2007 federal tax return audit.
INCOME TAX EXPENSE — 2009 VS 2008
In 2009 and 2008, our effective tax rate was impacted by adjustments related to our deferred tax assets primarily driven by the closure of several tax
years under audit, as well as permanent items related to investment valuation.