Nordstrom 2010 Annual Report Download - page 28
Download and view the complete annual report
Please find page 28 of the 2010 Nordstrom annual report below. You can navigate through the pages in the report by either clicking on the pages listed below, or by using the keyword search tool below to find specific information within the annual report.-
 1
1 -
2
-
3
-
4
-
5
-
6
-
7
-
8
-
9
-
10
-
11
-
12
-
13
-
14
-
15
-
16
-
17
-
 18
18 -
 19
19 -
 20
20 -
 21
21 -
 22
22 -
 23
23 -
 24
24 -
 25
25 -
 26
26 -
 27
27 -
 28
28 -
 29
29 -
 30
30 -
 31
31 -
 32
32 -
 33
33 -
 34
34 -
 35
35 -
 36
36 -
 37
37 -
 38
38 -
39
-
40
-
41
-
42
-
43
-
44
-
45
-
46
-
47
-
48
-
49
-
50
-
51
-
52
-
53
-
54
-
55
-
56
-
57
-
58
-
59
-
60
-
61
-
62
-
63
-
64
-
65
-
66
-
67
-
68
-
69
-
70
-
71
-
72
-
73
-
74
-
75
-
76
-
77
-
78
-
79
-
80
-
81
-
82
-
83
-
84
-
85
-
86
-
87
-
88
 |
 |

20
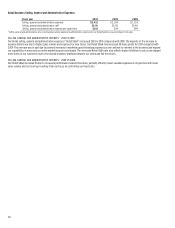
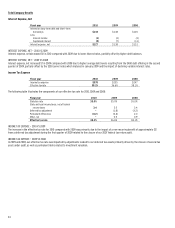
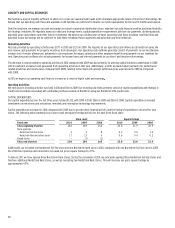
Retail Business Selling, General and Administrative Expenses
Fiscal year 2010 2009 2008
Selling, general and administrative expenses $2,412 $2,109 $2,103
Selling, general and administrative rate1 25.9% 25.5% 25.4%
Selling, general and administrative expense per square foot $103 $94 $99
1Selling, general and administrative rate is calculated as selling, general and administrative expenses for our Retail Business as a percentage of net sales.
SELLING, GENERAL AND ADMINISTRATIVE EXPENSES — 2010 VS 2009
Our Retail selling, general and administrative expenses (“Retail SG&A”) increased $303 in 2010 compared with 2009. The majority of the increase in
expense dollars was due to higher sales volume and expenses for new stores. Our Retail SG&A rate increased 38 basis points for 2010 compared with
2009. The increase was in part due to planned increases in marketing and technology expenses as we continue to reinvest in the business and expand
our capabilities in areas such as online marketing and social media. The increased Retail SG&A rate also reflects higher fulfillment costs as we shipped
more items to our customers due to the shared inventory platform between our online and full-line stores.
SELLING, GENERAL AND ADMINISTRATIVE EXPENSES — 2009 VS 2008
Our Retail SG&A increased $6 due to increased performance-related incentives, partially offset by lower variable expenses in conjunction with lower
sales volume and cost savings resulting from our focus on controlling our fixed costs.