Neiman Marcus 2009 Annual Report Download - page 37
Download and view the complete annual report
Please find page 37 of the 2009 Neiman Marcus annual report below. You can navigate through the pages in the report by either clicking on the pages listed below, or by using the keyword search tool below to find specific information within the annual report.-
 1
1 -
2
-
3
-
4
-
5
-
6
-
7
-
8
-
9
-
10
-
11
-
12
-
13
-
14
-
15
-
16
-
17
-
18
-
19
-
20
-
21
-
22
-
23
-
24
-
25
-
26
-
 27
27 -
 28
28 -
 29
29 -
 30
30 -
 31
31 -
 32
32 -
 33
33 -
 34
34 -
 35
35 -
 36
36 -
 37
37 -
 38
38 -
 39
39 -
 40
40 -
 41
41 -
 42
42 -
 43
43 -
 44
44 -
 45
45 -
 46
46 -
 47
47 -
48
-
49
-
50
-
51
-
52
-
53
-
54
-
55
-
56
-
57
-
58
-
59
-
60
-
61
-
62
-
63
-
64
-
65
-
66
-
67
-
68
-
69
-
70
-
71
-
72
-
73
-
74
-
75
-
76
-
77
-
78
-
79
-
80
-
81
-
82
-
83
-
84
-
85
-
86
-
87
-
88
-
89
-
90
-
91
-
92
-
93
-
94
-
95
-
96
-
97
-
98
-
99
-
100
-
101
-
102
-
103
-
104
-
105
-
106
-
107
-
108
-
109
-
110
-
111
-
112
-
113
-
114
-
115
-
116
-
117
-
118
-
119
-
120
-
121
-
122
-
123
-
124
-
125
-
126
-
127
-
128
-
129
-
130
-
131
-
132
-
133
-
134
-
135
-
136
-
137
-
138
-
139
-
140
-
141
-
142
-
143
-
144
-
145
-
146
-
147
-
148
-
149
-
150
-
151
-
152
-
153
-
154
-
155
-
156
-
157
-
158
-
159
-
160
-
161
-
162
-
163
-
164
-
165
-
166
-
167
-
168
-
169
-
170
-
171
-
172
-
173
-
174
-
175
-
176
-
177
-
178
-
179
-
180
-
181
-
182
-
183
-
184
-
185
-
186
-
187
-
188
-
189
-
190
-
191
-
192
-
193
-
194
-
195
-
196
-
197
-
198
-
199
-
200
-
201
-
202
-
203
-
204
-
205
-
206
-
207
-
208
-
209
-
210
-
211
-
212
-
213
-
214
-
215
-
216
-
217
-
218
-
219
-
220
-
221
-
222
-
223
-
224
-
225
-
226
-
227
-
228
-
229
-
230
-
231
-
232
-
233
-
234
-
235
-
236
-
237
-
238
-
239
-
240
-
241
-
242
-
243
-
244
-
245
-
246
-
247
-
248
-
249
-
250
-
251
-
252
-
253
-
254
-
255
-
256
-
257
-
258
-
259
-
260
-
261
-
262
-
263
-
264
-
265
-
266
-
267
-
268
-
269
-
270
-
271
-
272
-
273
-
274
-
275
-
276
-
277
-
278
-
279
-
280
-
281
-
282
-
283
-
284
-
285
-
286
-
287
-
288
-
289
-
290
-
291
-
292
-
293
-
294
-
295
-
296
-
297
-
298
-
299
-
300
-
301
-
302
-
303
-
304
-
305
-
306
-
307
-
308
-
309
-
310
-
311
-
312
-
313
-
314
-
315
-
316
-
317
-
318
-
319
-
320
-
321
-
322
-
323
-
324
-
325
-
326
-
327
-
328
-
329
-
330
-
331
-
332
-
333
-
334
-
335
-
336
-
337
-
338
-
339
-
340
-
341
-
342
-
343
-
344
-
345
-
346
-
347
-
348
-
349
-
350
-
351
-
352
-
353
-
354
-
355
-
356
-
357
-
358
-
359
-
360
-
361
-
362
-
363
-
364
-
365
-
366
-
367
-
368
-
369
-
370
-
371
-
372
-
373
-
374
-
375
-
376
-
377
-
378
-
379
-
380
-
381
-
382
-
383
-
384
-
385
-
386
-
387
-
388
-
389
-
390
-
391
-
392
-
393
-
394
-
395
-
396
-
397
-
398
-
399
-
400
-
401
-
402
-
403
-
404
-
405
-
406
-
407
-
408
-
409
-
410
-
411
-
412
-
413
-
414
-
415
-
416
-
417
-
418
-
419
-
420
-
421
-
422
-
423
-
424
-
425
-
426
-
427
-
428
-
429
-
430
-
431
-
432
-
433
-
434
-
435
-
436
-
437
-
438
-
439
-
440
-
441
-
442
-
443
-
444
-
445
-
446
-
447
-
448
-
449
-
450
-
451
-
452
-
453
-
454
-
455
-
456
-
457
-
458
-
459
-
460
-
461
-
462
-
463
-
464
-
465
-
466
-
467
-
468
-
469
-
470
-
471
-
472
-
473
-
474
-
475
-
476
-
477
-
478
-
479
-
480
-
481
-
482
-
483
-
484
-
485
-
486
-
487
-
488
-
489
-
490
-
491
-
492
-
493
-
494
-
495
-
496
-
497
-
498
-
499
-
500
-
501
-
502
-
503
-
504
-
505
-
506
-
507
-
508
-
509
 |
 |

Table of Contents
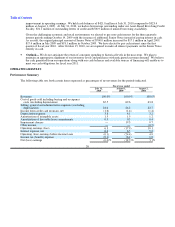
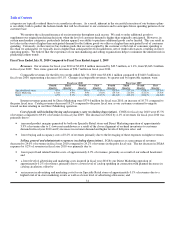
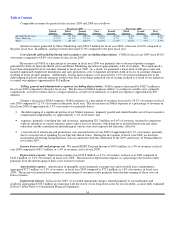
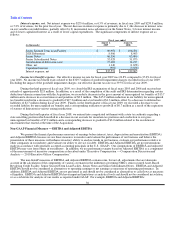
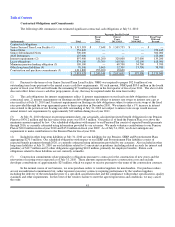
Comparable revenues by quarter for fiscal years 2009 and 2008 are as follows:
Fiscal year 2009 Fiscal year 2008
Fourth
Quarter
Third
Quarter
Second
Quarter
First
Quarter
Fourth
Quarter
Third
Quarter
Second
Quarter
First
Quarter
Specialty Retail stores (25.0)% (27.1)% (25.0)% (15.8)% (1.8)% (3.4)% 3.4% 6.4%
Direct Marketing (15.7)% (14.3)% (12.1)% (7.0)% 0.7% 2.0% 5.2% 7.1%
Total (23.4)% (25.1)% (22.8)% (14.5)% (1.4)% (2.5)% 3.7% 6.5%
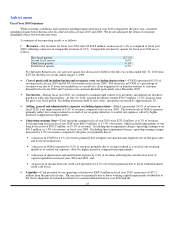
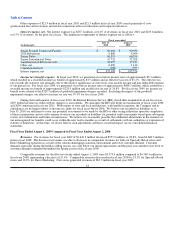
Internet revenues generated by Direct Marketing were $518.5 million for fiscal year 2009, a decrease of 8.2% compared to
the prior fiscal year. In addition, catalog revenues decreased 27.0% compared to the prior fiscal year.
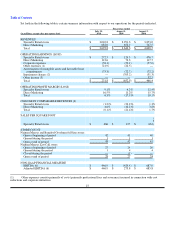
Cost of goods sold including buying and occupancy costs (excluding depreciation). COGS for fiscal year 2009 were 69.6%
of revenues compared to 63.8% of revenues for fiscal year 2008.
The increase in COGS as a percentage of revenues in fiscal year 2009 was primarily due to decreased product margins
generated by both our Specialty Retail stores and Direct Marketing operation of approximately 4.6% of revenues. We experienced a
lower than anticipated level of customer demand in fiscal year 2009. As a result, we generated a lower level of full-price sales and
incurred significantly higher net markdowns and sales promotions costs to liquidate inventories held in excess of customer demand,
resulting in lower product margins. Additionally, buying and occupancy costs increased by 1.2% of revenues primarily due to the
deleveraging of payroll and rent expenses on the lower level of revenues generated, net of savings realized as a result of our initiatives
to control our expenses (approximately $10 million).
Selling, general and administrative expenses (excluding depreciation). SG&A expenses decreased by $162.7 million in
fiscal year 2009 compared to the prior fiscal year. The decrease in SG&A expenses reflects 1) savings in variable costs, primarily
commissions, on lower revenues and 2) savings realized as a result of our initiatives to control our expenses (approximately $90
million).
Despite a decrease in SG&A expenses, SG&A expenses as a percentage of revenues increased to 24.2% of revenues in fiscal
year 2009 compared to 22.7% of revenues in the prior fiscal year. The net increase in SG&A expenses as a percentage of revenues in
fiscal year 2009 of approximately 1.5% of revenues was primarily due to:
• the deleveraging of a significant portion of our SG&A expenses, primarily payroll and related benefits net of lower incentive
compensation requirements, by approximately 1.1% of revenues; and
• expenses, primarily consulting fees and severance, aggregating $21.3 million, or 0.6% of revenues, incurred in connection
with our initiatives to control expenses and to reduce our cost structure, which initiatives included headcount and salary
reductions and the centralization and redesign of various store and corporate job functions; offset by
• a lower level of advertising and promotions costs incurred in fiscal year 2009 of approximately 0.1% of revenues, primarily
due to a lower level of spending by our Specialty Retail stores. During the first quarter of fiscal year 2008, we incurred
incremental advertising and promotions costs in connection with the celebration of the 100th anniversary of Neiman Marcus
in October 2007.
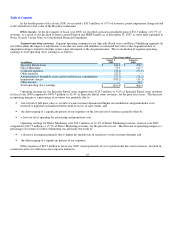
Income from credit card program, net. We earned HSBC Program Income of $50.0 million, or 1.4% of revenues, in fiscal
year 2009 compared to $65.7 million, or 1.4% of revenues, in fiscal year 2008.
Depreciation expense. Depreciation expense was $150.8 million, or 4.1% of revenues, in fiscal year 2009 compared to
$148.4 million, or 3.2% of revenues, in fiscal year 2008. The increase in depreciation expense as a percentage of revenues results
primarily from the deleveraging of these costs on lower revenues.
Amortization expense. Amortization of intangible assets (primarily customer lists and favorable lease commitments)
aggregated $72.7 million, or 2.0% of revenues, in fiscal year 2009 compared to $72.2 million, or 1.6% of revenues, in fiscal year
2008. The increase in amortization expense as a percentage of revenues results primarily from the deleveraging of these costs on
lower revenues.
Impairment charges. In fiscal year 2009, we recorded impairment charges, related primarily to our tradenames and
goodwill, aggregating $703.2 million in connection with the review of our long-lived assets for recoverability, as more fully explained
in Note 9 in the Notes to Consolidated Financial Statements.
34