Neiman Marcus 2009 Annual Report Download - page 34
Download and view the complete annual report
Please find page 34 of the 2009 Neiman Marcus annual report below. You can navigate through the pages in the report by either clicking on the pages listed below, or by using the keyword search tool below to find specific information within the annual report.-
 1
1 -
2
-
3
-
4
-
5
-
6
-
7
-
8
-
9
-
10
-
11
-
12
-
13
-
14
-
15
-
16
-
17
-
18
-
19
-
20
-
21
-
22
-
23
-
 24
24 -
 25
25 -
 26
26 -
 27
27 -
 28
28 -
 29
29 -
 30
30 -
 31
31 -
 32
32 -
 33
33 -
 34
34 -
 35
35 -
 36
36 -
 37
37 -
 38
38 -
 39
39 -
 40
40 -
 41
41 -
 42
42 -
 43
43 -
 44
44 -
45
-
46
-
47
-
48
-
49
-
50
-
51
-
52
-
53
-
54
-
55
-
56
-
57
-
58
-
59
-
60
-
61
-
62
-
63
-
64
-
65
-
66
-
67
-
68
-
69
-
70
-
71
-
72
-
73
-
74
-
75
-
76
-
77
-
78
-
79
-
80
-
81
-
82
-
83
-
84
-
85
-
86
-
87
-
88
-
89
-
90
-
91
-
92
-
93
-
94
-
95
-
96
-
97
-
98
-
99
-
100
-
101
-
102
-
103
-
104
-
105
-
106
-
107
-
108
-
109
-
110
-
111
-
112
-
113
-
114
-
115
-
116
-
117
-
118
-
119
-
120
-
121
-
122
-
123
-
124
-
125
-
126
-
127
-
128
-
129
-
130
-
131
-
132
-
133
-
134
-
135
-
136
-
137
-
138
-
139
-
140
-
141
-
142
-
143
-
144
-
145
-
146
-
147
-
148
-
149
-
150
-
151
-
152
-
153
-
154
-
155
-
156
-
157
-
158
-
159
-
160
-
161
-
162
-
163
-
164
-
165
-
166
-
167
-
168
-
169
-
170
-
171
-
172
-
173
-
174
-
175
-
176
-
177
-
178
-
179
-
180
-
181
-
182
-
183
-
184
-
185
-
186
-
187
-
188
-
189
-
190
-
191
-
192
-
193
-
194
-
195
-
196
-
197
-
198
-
199
-
200
-
201
-
202
-
203
-
204
-
205
-
206
-
207
-
208
-
209
-
210
-
211
-
212
-
213
-
214
-
215
-
216
-
217
-
218
-
219
-
220
-
221
-
222
-
223
-
224
-
225
-
226
-
227
-
228
-
229
-
230
-
231
-
232
-
233
-
234
-
235
-
236
-
237
-
238
-
239
-
240
-
241
-
242
-
243
-
244
-
245
-
246
-
247
-
248
-
249
-
250
-
251
-
252
-
253
-
254
-
255
-
256
-
257
-
258
-
259
-
260
-
261
-
262
-
263
-
264
-
265
-
266
-
267
-
268
-
269
-
270
-
271
-
272
-
273
-
274
-
275
-
276
-
277
-
278
-
279
-
280
-
281
-
282
-
283
-
284
-
285
-
286
-
287
-
288
-
289
-
290
-
291
-
292
-
293
-
294
-
295
-
296
-
297
-
298
-
299
-
300
-
301
-
302
-
303
-
304
-
305
-
306
-
307
-
308
-
309
-
310
-
311
-
312
-
313
-
314
-
315
-
316
-
317
-
318
-
319
-
320
-
321
-
322
-
323
-
324
-
325
-
326
-
327
-
328
-
329
-
330
-
331
-
332
-
333
-
334
-
335
-
336
-
337
-
338
-
339
-
340
-
341
-
342
-
343
-
344
-
345
-
346
-
347
-
348
-
349
-
350
-
351
-
352
-
353
-
354
-
355
-
356
-
357
-
358
-
359
-
360
-
361
-
362
-
363
-
364
-
365
-
366
-
367
-
368
-
369
-
370
-
371
-
372
-
373
-
374
-
375
-
376
-
377
-
378
-
379
-
380
-
381
-
382
-
383
-
384
-
385
-
386
-
387
-
388
-
389
-
390
-
391
-
392
-
393
-
394
-
395
-
396
-
397
-
398
-
399
-
400
-
401
-
402
-
403
-
404
-
405
-
406
-
407
-
408
-
409
-
410
-
411
-
412
-
413
-
414
-
415
-
416
-
417
-
418
-
419
-
420
-
421
-
422
-
423
-
424
-
425
-
426
-
427
-
428
-
429
-
430
-
431
-
432
-
433
-
434
-
435
-
436
-
437
-
438
-
439
-
440
-
441
-
442
-
443
-
444
-
445
-
446
-
447
-
448
-
449
-
450
-
451
-
452
-
453
-
454
-
455
-
456
-
457
-
458
-
459
-
460
-
461
-
462
-
463
-
464
-
465
-
466
-
467
-
468
-
469
-
470
-
471
-
472
-
473
-
474
-
475
-
476
-
477
-
478
-
479
-
480
-
481
-
482
-
483
-
484
-
485
-
486
-
487
-
488
-
489
-
490
-
491
-
492
-
493
-
494
-
495
-
496
-
497
-
498
-
499
-
500
-
501
-
502
-
503
-
504
-
505
-
506
-
507
-
508
-
509
 |
 |

Table of Contents
categories are typically ordered three to six months in advance. As a result, inherent in the successful execution of our business plans
is our ability both to predict the fashion trends that will be of interest to our customers and to anticipate future spending patterns of our
customer base.
We monitor the sales performance of our inventories throughout each season. We seek to order additional goods to
supplement our original purchasing decisions when the level of customer demand is higher than originally anticipated. However, in
certain merchandise categories, particularly fashion apparel, our ability to purchase additional goods can be limited. This can result in
lost sales in the event of higher than anticipated demand for the fashion goods we offer or a higher than anticipated level of consumer
spending. Conversely, in the event we buy fashion goods that are not accepted by the customer or the level of consumer spending is
less than we anticipated, we typically incur a higher than anticipated level of markdowns, net of vendor allowances, resulting in lower
operating profits. We believe that the experience of our merchandising and selling organizations helps to minimize the inherent risk in
predicting fashion trends.
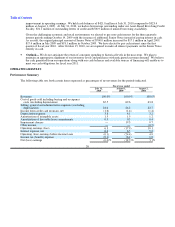
Fiscal Year Ended July 31, 2010 Compared to Fiscal Year Ended August 1, 2009
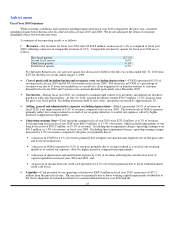
Revenues. Our revenues for fiscal year 2010 of $3,692.8 million increased by $49.5 million, or 1.4%, from $3,643.3 million
in fiscal year 2009. New stores generated revenues of $56.7 million in fiscal year 2010.
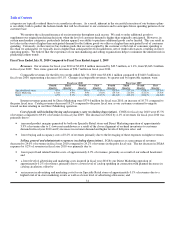
Comparable revenues for the fifty-two weeks ended July 31, 2010 were $3,636.1 million compared to $3,640.5 million in
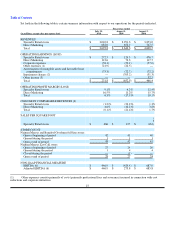
fiscal year 2009, representing a decrease of 0.1%. Changes in comparable revenues, by quarter and by reportable segment, were:
Fiscal year 2010 Fiscal year 2009
Fourth
Quarter
Third
Quarter
Second
Quarter
First
Quarter
Fourth
Quarter
Third
Quarter
Second
Quarter
First
Quarter
Specialty Retail stores 4.9% 9.5% (0.6)% (14.9)% (25.0)% (27.1)% (25.0)% (15.8)%
Direct Marketing 13.6% 6.9% 5.9% (7.2)% (15.7)% (14.3)% (12.1)% (7.0)%
Total 6.5% 9.1% 0.6% (13.7)% (23.4)% (25.1)% (22.8)% (14.5)%
Internet revenues generated by Direct Marketing were $574.0 million for fiscal year 2010, an increase of 10.7% compared to
the prior fiscal year. Catalog revenues decreased 19.2% compared to the prior fiscal year as our customers continued to migrate
toward on-line retailing in our Direct Marketing operation.
Cost of goods sold including buying and occupancy costs (excluding depreciation). COGS for fiscal year 2010 were 65.5%
of revenues compared to 69.6% of revenues for fiscal year 2009. The decrease in COGS by 4.1% of revenues for fiscal year 2010 was
primarily due to:
• increased product margins generated by both our Specialty Retail stores and Direct Marketing operation of approximately
3.9% of revenues due to 1) lower net markdowns as a result of the closer alignment of on-hand inventories to customer
demand in fiscal year 2010 and 2) increases in customer demand and higher levels of full-price sales; and
• lower buying and occupancy costs of 0.2% of revenues primarily due to the leveraging of these expenses on higher revenues.
Selling, general and administrative expenses (excluding depreciation). SG&A expenses as a percentage of revenues
decreased to 24.0% of revenues in fiscal year 2010 compared to 24.2% of revenues in the prior fiscal year. The net decrease in SG&A
expenses by 0.2% of revenues in fiscal year 2010 was primarily due to:
• lower payroll and related benefits costs, of approximately 0.9% of revenues, primarily as a result of our reduced headcount;
and
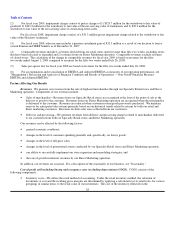
• a lower level of advertising and marketing costs incurred in fiscal year 2010 by our Direct Marketing operation of
approximately 0.2% of revenues, primarily due to a lower level of catalog spending in connection with planned decreases in
catalog circulation; offset by
• an increase in advertising and marketing costs for our Specialty Retail stores of approximately 0.1% of revenues due to a
higher level of in-store marketing events as well as a lower level of advertising allowances; and
31