Neiman Marcus 2009 Annual Report Download - page 35
Download and view the complete annual report
Please find page 35 of the 2009 Neiman Marcus annual report below. You can navigate through the pages in the report by either clicking on the pages listed below, or by using the keyword search tool below to find specific information within the annual report.-
 1
1 -
2
-
3
-
4
-
5
-
6
-
7
-
8
-
9
-
10
-
11
-
12
-
13
-
14
-
15
-
16
-
17
-
18
-
19
-
20
-
21
-
22
-
23
-
24
-
 25
25 -
 26
26 -
 27
27 -
 28
28 -
 29
29 -
 30
30 -
 31
31 -
 32
32 -
 33
33 -
 34
34 -
 35
35 -
 36
36 -
 37
37 -
 38
38 -
 39
39 -
 40
40 -
 41
41 -
 42
42 -
 43
43 -
 44
44 -
 45
45 -
46
-
47
-
48
-
49
-
50
-
51
-
52
-
53
-
54
-
55
-
56
-
57
-
58
-
59
-
60
-
61
-
62
-
63
-
64
-
65
-
66
-
67
-
68
-
69
-
70
-
71
-
72
-
73
-
74
-
75
-
76
-
77
-
78
-
79
-
80
-
81
-
82
-
83
-
84
-
85
-
86
-
87
-
88
-
89
-
90
-
91
-
92
-
93
-
94
-
95
-
96
-
97
-
98
-
99
-
100
-
101
-
102
-
103
-
104
-
105
-
106
-
107
-
108
-
109
-
110
-
111
-
112
-
113
-
114
-
115
-
116
-
117
-
118
-
119
-
120
-
121
-
122
-
123
-
124
-
125
-
126
-
127
-
128
-
129
-
130
-
131
-
132
-
133
-
134
-
135
-
136
-
137
-
138
-
139
-
140
-
141
-
142
-
143
-
144
-
145
-
146
-
147
-
148
-
149
-
150
-
151
-
152
-
153
-
154
-
155
-
156
-
157
-
158
-
159
-
160
-
161
-
162
-
163
-
164
-
165
-
166
-
167
-
168
-
169
-
170
-
171
-
172
-
173
-
174
-
175
-
176
-
177
-
178
-
179
-
180
-
181
-
182
-
183
-
184
-
185
-
186
-
187
-
188
-
189
-
190
-
191
-
192
-
193
-
194
-
195
-
196
-
197
-
198
-
199
-
200
-
201
-
202
-
203
-
204
-
205
-
206
-
207
-
208
-
209
-
210
-
211
-
212
-
213
-
214
-
215
-
216
-
217
-
218
-
219
-
220
-
221
-
222
-
223
-
224
-
225
-
226
-
227
-
228
-
229
-
230
-
231
-
232
-
233
-
234
-
235
-
236
-
237
-
238
-
239
-
240
-
241
-
242
-
243
-
244
-
245
-
246
-
247
-
248
-
249
-
250
-
251
-
252
-
253
-
254
-
255
-
256
-
257
-
258
-
259
-
260
-
261
-
262
-
263
-
264
-
265
-
266
-
267
-
268
-
269
-
270
-
271
-
272
-
273
-
274
-
275
-
276
-
277
-
278
-
279
-
280
-
281
-
282
-
283
-
284
-
285
-
286
-
287
-
288
-
289
-
290
-
291
-
292
-
293
-
294
-
295
-
296
-
297
-
298
-
299
-
300
-
301
-
302
-
303
-
304
-
305
-
306
-
307
-
308
-
309
-
310
-
311
-
312
-
313
-
314
-
315
-
316
-
317
-
318
-
319
-
320
-
321
-
322
-
323
-
324
-
325
-
326
-
327
-
328
-
329
-
330
-
331
-
332
-
333
-
334
-
335
-
336
-
337
-
338
-
339
-
340
-
341
-
342
-
343
-
344
-
345
-
346
-
347
-
348
-
349
-
350
-
351
-
352
-
353
-
354
-
355
-
356
-
357
-
358
-
359
-
360
-
361
-
362
-
363
-
364
-
365
-
366
-
367
-
368
-
369
-
370
-
371
-
372
-
373
-
374
-
375
-
376
-
377
-
378
-
379
-
380
-
381
-
382
-
383
-
384
-
385
-
386
-
387
-
388
-
389
-
390
-
391
-
392
-
393
-
394
-
395
-
396
-
397
-
398
-
399
-
400
-
401
-
402
-
403
-
404
-
405
-
406
-
407
-
408
-
409
-
410
-
411
-
412
-
413
-
414
-
415
-
416
-
417
-
418
-
419
-
420
-
421
-
422
-
423
-
424
-
425
-
426
-
427
-
428
-
429
-
430
-
431
-
432
-
433
-
434
-
435
-
436
-
437
-
438
-
439
-
440
-
441
-
442
-
443
-
444
-
445
-
446
-
447
-
448
-
449
-
450
-
451
-
452
-
453
-
454
-
455
-
456
-
457
-
458
-
459
-
460
-
461
-
462
-
463
-
464
-
465
-
466
-
467
-
468
-
469
-
470
-
471
-
472
-
473
-
474
-
475
-
476
-
477
-
478
-
479
-
480
-
481
-
482
-
483
-
484
-
485
-
486
-
487
-
488
-
489
-
490
-
491
-
492
-
493
-
494
-
495
-
496
-
497
-
498
-
499
-
500
-
501
-
502
-
503
-
504
-
505
-
506
-
507
-
508
-
509
 |
 |

Table of Contents
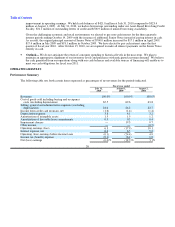
• higher incentive compensation requirements by approximately 0.7% of revenues.
Income from credit card program, net. We earned HSBC Program Income of $59.1 million, or 1.6% of revenues, in fiscal
year 2010 compared to $50.0 million, or 1.4% of revenues, in fiscal year 2009 primarily due to improvements in the profitability and
performance of the credit card portfolio, primarily as the result of lower shared credit card losses.
Depreciation expense. Depreciation expense was $141.8 million, or 3.8% of revenues, in fiscal year 2010 compared to
$150.8 million, or 4.1% of revenues, in fiscal year 2009. The decrease in depreciation results primarily from recent lower levels of
capital spending and delays in certain real estate projects in response to recent unfavorable economic conditions.
Amortization expense. Amortization of intangible assets (primarily customer lists and favorable lease commitments)
aggregated $73.3 million, or 2.0% of revenues, in fiscal year 2010 compared to $72.7 million, or 2.0% of revenues, in fiscal year
2009.
Impairment charges. In fiscal year 2009, we recorded impairment charges, related primarily to our tradenames and
goodwill, aggregating $703.2 million in connection with the review of our long-lived assets for recoverability, as more fully explained
in Note 9 in the Notes to Consolidated Financial Statements.
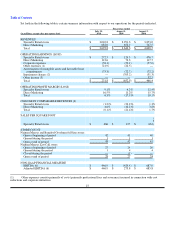
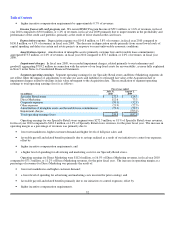
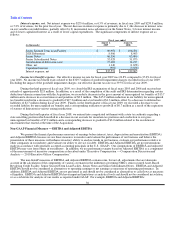
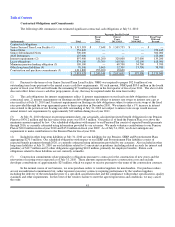
Segment operating earnings. Segment operating earnings for our Specialty Retail stores and Direct Marketing segments do
not reflect either the impact of adjustments to revalue our assets and liabilities to estimated fair value at the Acquisition date or
impairment charges related to declines in fair value subsequent to the Acquisition date. The reconciliation of segment operating
earnings to total operating earnings (loss) is as follows:
Fiscal year ended
(in millions)
July 31,
2010
August 1,
2009
Specialty Retail stores $ 272.5 $ 124.3
Direct Marketing 112.6 73.3
Corporate expenses (58.1) (52.1)
Other expenses (21.9) (22.5)
Amortization of intangible assets and favorable lease commitments (73.3) (72.7)
Impairment charges — (703.2)
Total operating earnings (loss) $ 231.8 $ (652.9)
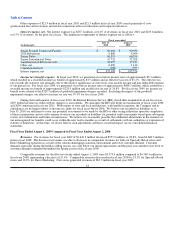
Operating earnings for our Specialty Retail stores segment were $272.5 million, or 9.1% of Specialty Retail stores revenues,
for fiscal year 2010 compared to $124.3 million, or 4.2% of Specialty Retail stores revenues, for the prior fiscal year. The increase in
operating margin as a percentage of revenues was primarily due to:
• lower net markdowns, higher customer demand and higher levels of full-price sales; and
• favorable payroll and related benefits primarily due to savings realized as a result of our initiatives to control our expenses;
offset by
• higher incentive compensation requirements; and
• a higher level of spending for advertising and marketing costs for our Specialty Retail stores.
Operating earnings for Direct Marketing were $112.6 million, or 16.5% of Direct Marketing revenues, in fiscal year 2010
compared to $73.3 million, or 11.2% of Direct Marketing revenues, for the prior fiscal year. The increase in operating margin as a
percentage of revenues for Direct Marketing was primarily the result of:
• lower net markdowns and higher customer demand;
• a lower level of spending for advertising and marketing costs incurred for print catalogs; and
• favorable payroll and related benefits primarily due to our initiatives to control expenses; offset by
• higher incentive compensation requirements.
32