Neiman Marcus 2009 Annual Report Download - page 101
Download and view the complete annual report
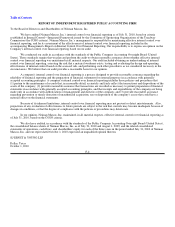
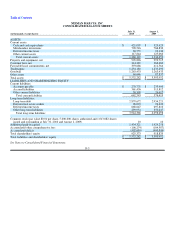
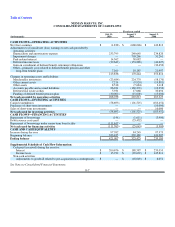
Please find page 101 of the 2009 Neiman Marcus annual report below. You can navigate through the pages in the report by either clicking on the pages listed below, or by using the keyword search tool below to find specific information within the annual report.-
 1
1 -
2
-
3
-
4
-
5
-
6
-
7
-
8
-
9
-
10
-
11
-
12
-
13
-
14
-
15
-
16
-
17
-
18
-
19
-
20
-
21
-
22
-
23
-
24
-
25
-
26
-
27
-
28
-
29
-
30
-
31
-
32
-
33
-
34
-
35
-
36
-
37
-
38
-
39
-
40
-
41
-
42
-
43
-
44
-
45
-
46
-
47
-
48
-
49
-
50
-
51
-
52
-
53
-
54
-
55
-
56
-
57
-
58
-
59
-
60
-
61
-
62
-
63
-
64
-
65
-
66
-
67
-
68
-
69
-
70
-
71
-
72
-
73
-
74
-
75
-
76
-
77
-
78
-
79
-
80
-
81
-
82
-
83
-
84
-
85
-
86
-
87
-
88
-
89
-
90
-
 91
91 -
 92
92 -
 93
93 -
 94
94 -
 95
95 -
 96
96 -
 97
97 -
 98
98 -
 99
99 -
 100
100 -
 101
101 -
 102
102 -
 103
103 -
 104
104 -
 105
105 -
 106
106 -
 107
107 -
 108
108 -
 109
109 -
 110
110 -
 111
111 -
112
-
113
-
114
-
115
-
116
-
117
-
118
-
119
-
120
-
121
-
122
-
123
-
124
-
125
-
126
-
127
-
128
-
129
-
130
-
131
-
132
-
133
-
134
-
135
-
136
-
137
-
138
-
139
-
140
-
141
-
142
-
143
-
144
-
145
-
146
-
147
-
148
-
149
-
150
-
151
-
152
-
153
-
154
-
155
-
156
-
157
-
158
-
159
-
160
-
161
-
162
-
163
-
164
-
165
-
166
-
167
-
168
-
169
-
170
-
171
-
172
-
173
-
174
-
175
-
176
-
177
-
178
-
179
-
180
-
181
-
182
-
183
-
184
-
185
-
186
-
187
-
188
-
189
-
190
-
191
-
192
-
193
-
194
-
195
-
196
-
197
-
198
-
199
-
200
-
201
-
202
-
203
-
204
-
205
-
206
-
207
-
208
-
209
-
210
-
211
-
212
-
213
-
214
-
215
-
216
-
217
-
218
-
219
-
220
-
221
-
222
-
223
-
224
-
225
-
226
-
227
-
228
-
229
-
230
-
231
-
232
-
233
-
234
-
235
-
236
-
237
-
238
-
239
-
240
-
241
-
242
-
243
-
244
-
245
-
246
-
247
-
248
-
249
-
250
-
251
-
252
-
253
-
254
-
255
-
256
-
257
-
258
-
259
-
260
-
261
-
262
-
263
-
264
-
265
-
266
-
267
-
268
-
269
-
270
-
271
-
272
-
273
-
274
-
275
-
276
-
277
-
278
-
279
-
280
-
281
-
282
-
283
-
284
-
285
-
286
-
287
-
288
-
289
-
290
-
291
-
292
-
293
-
294
-
295
-
296
-
297
-
298
-
299
-
300
-
301
-
302
-
303
-
304
-
305
-
306
-
307
-
308
-
309
-
310
-
311
-
312
-
313
-
314
-
315
-
316
-
317
-
318
-
319
-
320
-
321
-
322
-
323
-
324
-
325
-
326
-
327
-
328
-
329
-
330
-
331
-
332
-
333
-
334
-
335
-
336
-
337
-
338
-
339
-
340
-
341
-
342
-
343
-
344
-
345
-
346
-
347
-
348
-
349
-
350
-
351
-
352
-
353
-
354
-
355
-
356
-
357
-
358
-
359
-
360
-
361
-
362
-
363
-
364
-
365
-
366
-
367
-
368
-
369
-
370
-
371
-
372
-
373
-
374
-
375
-
376
-
377
-
378
-
379
-
380
-
381
-
382
-
383
-
384
-
385
-
386
-
387
-
388
-
389
-
390
-
391
-
392
-
393
-
394
-
395
-
396
-
397
-
398
-
399
-
400
-
401
-
402
-
403
-
404
-
405
-
406
-
407
-
408
-
409
-
410
-
411
-
412
-
413
-
414
-
415
-
416
-
417
-
418
-
419
-
420
-
421
-
422
-
423
-
424
-
425
-
426
-
427
-
428
-
429
-
430
-
431
-
432
-
433
-
434
-
435
-
436
-
437
-
438
-
439
-
440
-
441
-
442
-
443
-
444
-
445
-
446
-
447
-
448
-
449
-
450
-
451
-
452
-
453
-
454
-
455
-
456
-
457
-
458
-
459
-
460
-
461
-
462
-
463
-
464
-
465
-
466
-
467
-
468
-
469
-
470
-
471
-
472
-
473
-
474
-
475
-
476
-
477
-
478
-
479
-
480
-
481
-
482
-
483
-
484
-
485
-
486
-
487
-
488
-
489
-
490
-
491
-
492
-
493
-
494
-
495
-
496
-
497
-
498
-
499
-
500
-
501
-
502
-
503
-
504
-
505
-
506
-
507
-
508
-
509
 |
 |

Table of Contents
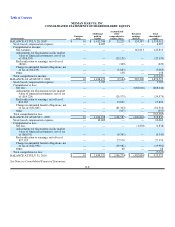
NEIMAN MARCUS, INC.
CONSOLIDATED STATEMENTS OF SHAREHOLDERS' EQUITY
(in thousands)
Common
stock
Additional
paid-in
capital
Accumulated
other
comprehensive
income (loss)
Retained
earnings
(deficit)
Total
shareholders'
equity
BALANCE AT JULY 28, 2007 $ 10 $ 1,412,386 $ 21,229 $ 124,387 $ 1,558,012
Stock based compensation expense — 6,087 — — 6,087
Comprehensive income:
Net earnings — — — 142,813 142,813
Adjustments for fluctuations in fair market
value of financial instruments, net of tax
of ($16,355) — — (25,159) — (25,159)
Reclassification to earnings, net of tax of
($214) — — (329) — (329)
Change in unfunded benefit obligations, net
of tax of ($3,239) — — (5,063) — (5,063)
Other — — 158 — 158
Total comprehensive income 112,420
BALANCE AT AUGUST 2, 2008 10 1,418,473 (9,164)267,200 1,676,519
Stock based compensation expense — 5,785 — — 5,785
Comprehensive loss:
Net loss — — — (668,046) (668,046)
Adjustments for fluctuations in fair market
value of financial instruments, net of tax
of ($19,229) — — (29,575) — (29,575)
Reclassification to earnings, net of tax of
$10,287 — — 15,822 — 15,822
Change in unfunded benefit obligations, net
of tax of ($52,865) — — (81,313) — (81,313)
Other — — (357) — (357)
Total comprehensive loss (763,469)
BALANCE AT AUGUST 1, 2009 10 1,424,258 (104,587)(400,846)918,835
Stock based compensation expense — 10,063 — — 10,063
Comprehensive loss:
Net loss — — — (1,838) (1,838)
Adjustments for fluctuations in fair market
value of financial instruments, net of tax
of ($6,074) — — (9,343) — (9,343)
Reclassification to earnings, net of tax of
$17,925 — — 27,570 — 27,570
Change in unfunded benefit obligations, net
of tax of ($12,992) — — (19,982) — (19,982)
Other — — 68 — 68
Total comprehensive loss (3,525)
BALANCE AT JULY 31, 2010 $ 10 $ 1,434,321 $ (106,274)$ (402,684)$ 925,373
See Notes to Consolidated Financial Statements.
F-8