Neiman Marcus 2009 Annual Report Download - page 28
Download and view the complete annual report
Please find page 28 of the 2009 Neiman Marcus annual report below. You can navigate through the pages in the report by either clicking on the pages listed below, or by using the keyword search tool below to find specific information within the annual report.-
 1
1 -
2
-
3
-
4
-
5
-
6
-
7
-
8
-
9
-
10
-
11
-
12
-
13
-
14
-
15
-
16
-
17
-
 18
18 -
 19
19 -
 20
20 -
 21
21 -
 22
22 -
 23
23 -
 24
24 -
 25
25 -
 26
26 -
 27
27 -
 28
28 -
 29
29 -
 30
30 -
 31
31 -
 32
32 -
 33
33 -
 34
34 -
 35
35 -
 36
36 -
 37
37 -
 38
38 -
39
-
40
-
41
-
42
-
43
-
44
-
45
-
46
-
47
-
48
-
49
-
50
-
51
-
52
-
53
-
54
-
55
-
56
-
57
-
58
-
59
-
60
-
61
-
62
-
63
-
64
-
65
-
66
-
67
-
68
-
69
-
70
-
71
-
72
-
73
-
74
-
75
-
76
-
77
-
78
-
79
-
80
-
81
-
82
-
83
-
84
-
85
-
86
-
87
-
88
-
89
-
90
-
91
-
92
-
93
-
94
-
95
-
96
-
97
-
98
-
99
-
100
-
101
-
102
-
103
-
104
-
105
-
106
-
107
-
108
-
109
-
110
-
111
-
112
-
113
-
114
-
115
-
116
-
117
-
118
-
119
-
120
-
121
-
122
-
123
-
124
-
125
-
126
-
127
-
128
-
129
-
130
-
131
-
132
-
133
-
134
-
135
-
136
-
137
-
138
-
139
-
140
-
141
-
142
-
143
-
144
-
145
-
146
-
147
-
148
-
149
-
150
-
151
-
152
-
153
-
154
-
155
-
156
-
157
-
158
-
159
-
160
-
161
-
162
-
163
-
164
-
165
-
166
-
167
-
168
-
169
-
170
-
171
-
172
-
173
-
174
-
175
-
176
-
177
-
178
-
179
-
180
-
181
-
182
-
183
-
184
-
185
-
186
-
187
-
188
-
189
-
190
-
191
-
192
-
193
-
194
-
195
-
196
-
197
-
198
-
199
-
200
-
201
-
202
-
203
-
204
-
205
-
206
-
207
-
208
-
209
-
210
-
211
-
212
-
213
-
214
-
215
-
216
-
217
-
218
-
219
-
220
-
221
-
222
-
223
-
224
-
225
-
226
-
227
-
228
-
229
-
230
-
231
-
232
-
233
-
234
-
235
-
236
-
237
-
238
-
239
-
240
-
241
-
242
-
243
-
244
-
245
-
246
-
247
-
248
-
249
-
250
-
251
-
252
-
253
-
254
-
255
-
256
-
257
-
258
-
259
-
260
-
261
-
262
-
263
-
264
-
265
-
266
-
267
-
268
-
269
-
270
-
271
-
272
-
273
-
274
-
275
-
276
-
277
-
278
-
279
-
280
-
281
-
282
-
283
-
284
-
285
-
286
-
287
-
288
-
289
-
290
-
291
-
292
-
293
-
294
-
295
-
296
-
297
-
298
-
299
-
300
-
301
-
302
-
303
-
304
-
305
-
306
-
307
-
308
-
309
-
310
-
311
-
312
-
313
-
314
-
315
-
316
-
317
-
318
-
319
-
320
-
321
-
322
-
323
-
324
-
325
-
326
-
327
-
328
-
329
-
330
-
331
-
332
-
333
-
334
-
335
-
336
-
337
-
338
-
339
-
340
-
341
-
342
-
343
-
344
-
345
-
346
-
347
-
348
-
349
-
350
-
351
-
352
-
353
-
354
-
355
-
356
-
357
-
358
-
359
-
360
-
361
-
362
-
363
-
364
-
365
-
366
-
367
-
368
-
369
-
370
-
371
-
372
-
373
-
374
-
375
-
376
-
377
-
378
-
379
-
380
-
381
-
382
-
383
-
384
-
385
-
386
-
387
-
388
-
389
-
390
-
391
-
392
-
393
-
394
-
395
-
396
-
397
-
398
-
399
-
400
-
401
-
402
-
403
-
404
-
405
-
406
-
407
-
408
-
409
-
410
-
411
-
412
-
413
-
414
-
415
-
416
-
417
-
418
-
419
-
420
-
421
-
422
-
423
-
424
-
425
-
426
-
427
-
428
-
429
-
430
-
431
-
432
-
433
-
434
-
435
-
436
-
437
-
438
-
439
-
440
-
441
-
442
-
443
-
444
-
445
-
446
-
447
-
448
-
449
-
450
-
451
-
452
-
453
-
454
-
455
-
456
-
457
-
458
-
459
-
460
-
461
-
462
-
463
-
464
-
465
-
466
-
467
-
468
-
469
-
470
-
471
-
472
-
473
-
474
-
475
-
476
-
477
-
478
-
479
-
480
-
481
-
482
-
483
-
484
-
485
-
486
-
487
-
488
-
489
-
490
-
491
-
492
-
493
-
494
-
495
-
496
-
497
-
498
-
499
-
500
-
501
-
502
-
503
-
504
-
505
-
506
-
507
-
508
-
509
 |
 |

Table of Contents
Fiscal Year 2010 Summary
While economic conditions and consumer spending improved in fiscal year 2010 compared to the prior year, consumer
spending remains below historical levels achieved in fiscal years 2007 and 2008. We do not anticipate the return of consumer
spending to these levels in the near-term.
A summary of our operating results is as follows:
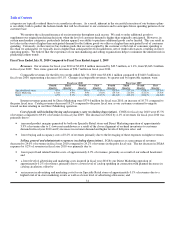
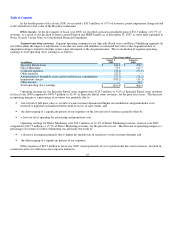
• Revenues—Our revenues for fiscal year 2010 were $3,692.8 million, an increase of 1.4% as compared to fiscal year
2009, reflecting a decrease in comparable revenues of 0.1%. Comparable revenues by quarter for fiscal year 2010 are as
follows:
First fiscal quarter (13.7)%
Second fiscal quarter 0.6%
Third fiscal quarter 9.1%
Fourth fiscal quarter 6.5%
For Specialty Retail stores, our sales per square foot decreased to $466 for the fifty-two weeks ended July 31, 2010 from
$475 for the fifty-two weeks ended August 1, 2009.
• Cost of goods sold including buying and occupancy costs (excluding depreciation)—COGS represented 65.5% of
revenues in fiscal year 2010 and 69.6% of revenues in fiscal year 2009. The decreases in COGS as a percentage of
revenues were due to 1) lower net markdowns as a result of a closer alignment of on-hand inventories to customer
demand in fiscal year 2010 and 2) increases in customer demand, particularly since December 2009.
• Inventories—During fiscal year 2010, we continued to maintain tight control over inventory and aligned our inventory
purchases with sales expectations. At July 31, 2010, on-hand inventories totaled $790.5 million, a 3.1% increase from
the prior year fiscal period. Excluding inventories held by new stores, inventories increased by approximately 2%.
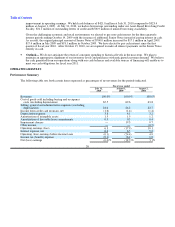
• Selling, general and administrative expenses (excluding depreciation)—SG&A represented 24.0% of revenues in
fiscal 2010, a net improvement of 0.2% of revenues compared to fiscal year 2009. The lower levels of SG&A expenses
primarily reflect net savings realized as a result of our on-going initiatives to control our expenses, offset by higher
incentive compensation requirements.
• Operating earnings (loss)—Total operating earnings in fiscal year 2010 were $231.8 million, or 6.3% of revenues.
Total operating losses in fiscal year 2009 were $652.9 million, or 17.9% of revenues, which included impairments of our
long-lived assets of $703.2 million, or 19.3% of revenues. Excluding these impairment charges, operating earnings were
$50.3 million, or 1.4% of revenues, in fiscal year 2009. Excluding these impairment charges, operating earnings margin
increased by 4.9% of revenues compared to the prior year primarily due to:
• a decrease in COGS by 4.1% of revenues primarily due to higher customer demand, higher levels of full-price sales
and lower net markdowns;
• a decrease in SG&A expenses by 0.2% of revenues primarily due to savings realized as a result of our on-going
initiatives to control our expenses, offset by higher incentive compensation requirements;
• a decrease in depreciation and amortization expense by 0.3% of revenues reflecting the current lower level of
capital expenditures in fiscal years 2010 and 2009; and
• an increase in income from our credit card operations by 0.2% of revenues primarily due to lower estimated shared
credit card losses.
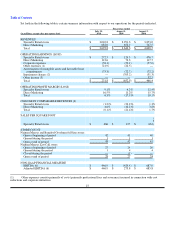
• Liquidity—Cash provided by our operating activities was $268.0 million in fiscal year 2010, an increase of $57.2
million from the prior fiscal year. This increase was primarily due to lower working capital requirements attributable to
the closer alignment of on-hand inventories to customer demand in fiscal year 2010 and the
25