Neiman Marcus 2007 Annual Report Download - page 94
Download and view the complete annual report
Please find page 94 of the 2007 Neiman Marcus annual report below. You can navigate through the pages in the report by either clicking on the pages listed below, or by using the keyword search tool below to find specific information within the annual report.-
 1
1 -
2
-
3
-
4
-
5
-
6
-
7
-
8
-
9
-
10
-
11
-
12
-
13
-
14
-
15
-
16
-
17
-
18
-
19
-
20
-
21
-
22
-
23
-
24
-
25
-
26
-
27
-
28
-
29
-
30
-
31
-
32
-
33
-
34
-
35
-
36
-
37
-
38
-
39
-
40
-
41
-
42
-
43
-
44
-
45
-
46
-
47
-
48
-
49
-
50
-
51
-
52
-
53
-
54
-
55
-
56
-
57
-
58
-
59
-
60
-
61
-
62
-
63
-
64
-
65
-
66
-
67
-
68
-
69
-
70
-
71
-
72
-
73
-
74
-
75
-
76
-
77
-
78
-
79
-
80
-
81
-
82
-
83
-
 84
84 -
 85
85 -
 86
86 -
 87
87 -
 88
88 -
 89
89 -
 90
90 -
 91
91 -
 92
92 -
 93
93 -
 94
94 -
 95
95 -
 96
96 -
 97
97 -
 98
98 -
 99
99 -
 100
100 -
 101
101 -
 102
102 -
 103
103 -
 104
104 -
105
-
106
-
107
-
108
-
109
-
110
-
111
-
112
-
113
-
114
-
115
-
116
-
117
-
118
-
119
-
120
-
121
-
122
-
123
-
124
-
125
-
126
-
127
-
128
-
129
-
130
-
131
-
132
-
133
-
134
-
135
-
136
-
137
-
138
-
139
-
140
-
141
-
142
-
143
-
144
-
145
-
146
-
147
-
148
-
149
-
150
-
151
-
152
-
153
-
154
-
155
-
156
-
157
-
158
-
159
-
160
-
161
-
162
-
163
-
164
-
165
-
166
-
167
-
168
-
169
-
170
-
171
-
172
-
173
-
174
-
175
-
176
-
177
-
178
-
179
-
180
-
181
-
182
-
183
-
184
-
185
-
186
-
187
-
188
-
189
-
190
-
191
-
192
-
193
-
194
-
195
-
196
-
197
-
198
-
199
-
200
-
201
-
202
-
203
-
204
-
205
-
206
 |
 |

Table of Contents
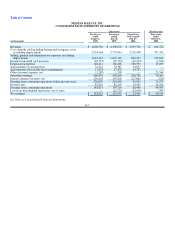
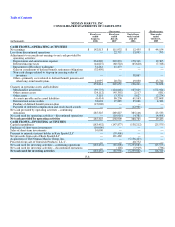
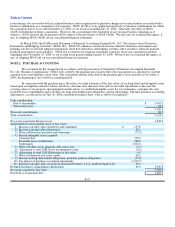
NEIMAN MARCUS, INC.
CONSOLIDATED STATEMENTS OF CASH FLOWS
(Successor) (Predecessor)
(in thousands)
Fiscal year
ended
August 2,
2008
Fiscal year
ended
July 28,
2007
Forty-three
weeks ended
July 29,
2006
Nine weeks
ended
October 1,
2005
CASH FLOWS—FINANCING ACTIVITIES
Repayment of borrowings (3,900) (4,918) (1,078) —
Borrowings under asset-based revolving credit facility — — 150,000 —
Repayment of borrowings under asset-based revolving credit
facility — — (150,000) —
Borrowings under senior term loan facility — — 1,975,000 —
Repayment of borrowings under senior term loan facility — (250,000) (100,000) —
Borrowings under senior notes and subordinated debt — — 1,200,000 —
Repayment of senior notes due 2008 — — (134,734) —
Debt issuance costs paid — (1,449) (102,854) —
Cash equity contributions — — 1,427,739 —
Cash dividends paid — — — (7,346)
Proceeds from purchase of common stock, exercises of stock
options and restricted stock grants — 1,148 — —
Net cash (used for) provided by financing activities –
continuing operations (3,900) (255,219) 4,264,073 (7,346)
Net cash (used for) provided by financing activities –
discontinued operations — (1,675)(4,168) 5,000
Net cash (used for) provided by financing activities (3,900)(256,894)4,259,905 (2,346)
CASH AND CASH EQUIVALENTS
Increase (decrease) during the year 97,973 (83,921) (619,132) (9,222)
Beginning balance 141,207 225,128 844,260 853,482
Ending balance 239,180 141,207 225,128 844,260
Less cash and cash equivalents of discontinued operations — — 1,388 1,056
Ending balance - continuing operations $ 239,180 $ 141,207 $ 223,740 $ 843,204
Supplemental Schedule of Cash Flow Information:
Cash paid during the year for:
Interest $ 233,055 $ 259,709 $ 181,022 $ 134
Income taxes $ 145,811 $ 155,568 $ 22,815 $ 10,693
Noncash activities:
Equity contribution from Holding $ — $ — $ 25,000 $ —
Equity contribution from management shareholders $ — $ — $ 17,891 $ —
Reduction in equity for deemed dividend to management
shareholders $ — $ — $ 69,200 $ —
Additions to property and equipment $ — $ 1,733 $ 15,085 $ —
Adjustments to goodwill related to pre-acquisition tax
contingencies $ 6,051 $ — $ — $ —
See Notes to Consolidated Financial Statements.
F-9