Neiman Marcus 2007 Annual Report Download - page 113
Download and view the complete annual report
Please find page 113 of the 2007 Neiman Marcus annual report below. You can navigate through the pages in the report by either clicking on the pages listed below, or by using the keyword search tool below to find specific information within the annual report.-
 1
1 -
2
-
3
-
4
-
5
-
6
-
7
-
8
-
9
-
10
-
11
-
12
-
13
-
14
-
15
-
16
-
17
-
18
-
19
-
20
-
21
-
22
-
23
-
24
-
25
-
26
-
27
-
28
-
29
-
30
-
31
-
32
-
33
-
34
-
35
-
36
-
37
-
38
-
39
-
40
-
41
-
42
-
43
-
44
-
45
-
46
-
47
-
48
-
49
-
50
-
51
-
52
-
53
-
54
-
55
-
56
-
57
-
58
-
59
-
60
-
61
-
62
-
63
-
64
-
65
-
66
-
67
-
68
-
69
-
70
-
71
-
72
-
73
-
74
-
75
-
76
-
77
-
78
-
79
-
80
-
81
-
82
-
83
-
84
-
85
-
86
-
87
-
88
-
89
-
90
-
91
-
92
-
93
-
94
-
95
-
96
-
97
-
98
-
99
-
100
-
101
-
102
-
 103
103 -
 104
104 -
 105
105 -
 106
106 -
 107
107 -
 108
108 -
 109
109 -
 110
110 -
 111
111 -
 112
112 -
 113
113 -
 114
114 -
 115
115 -
 116
116 -
 117
117 -
 118
118 -
 119
119 -
 120
120 -
 121
121 -
 122
122 -
 123
123 -
124
-
125
-
126
-
127
-
128
-
129
-
130
-
131
-
132
-
133
-
134
-
135
-
136
-
137
-
138
-
139
-
140
-
141
-
142
-
143
-
144
-
145
-
146
-
147
-
148
-
149
-
150
-
151
-
152
-
153
-
154
-
155
-
156
-
157
-
158
-
159
-
160
-
161
-
162
-
163
-
164
-
165
-
166
-
167
-
168
-
169
-
170
-
171
-
172
-
173
-
174
-
175
-
176
-
177
-
178
-
179
-
180
-
181
-
182
-
183
-
184
-
185
-
186
-
187
-
188
-
189
-
190
-
191
-
192
-
193
-
194
-
195
-
196
-
197
-
198
-
199
-
200
-
201
-
202
-
203
-
204
-
205
-
206
 |
 |
Table of Contents
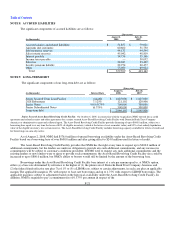
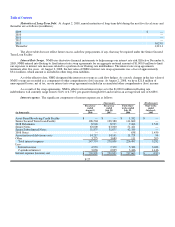
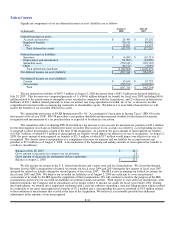
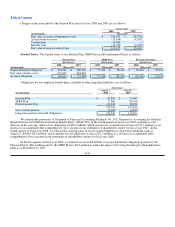
Maturities of Long-Term Debt. At August 2, 2008, annual maturities of long-term debt during the next five fiscal years and
thereafter are as follows (in millions):
2009 $ —
2010 —
2011 —
2012 —
2013 1,625.0
Thereafter 1,321.1
The above table does not reflect future excess cash flow prepayments, if any, that may be required under the Senior Secured
Term Loan Facility.
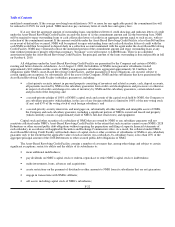
Interest Rate Swaps. NMG uses derivative financial instruments to help manage our interest rate risk. Effective December 6,
2005, NMG entered into floating to fixed interest rate swap agreements for an aggregate notional amount of $1,000.0 million to limit
our exposure to interest rate increases related to a portion of our floating rate indebtedness. The interest rate swap agreements
terminate after five years. At August 2, 2008, the fair value of NMG's interest rate swap agreements was a loss of approximately
$34.4 million, which amount is included in other long-term liabilities.
As of the effective date, NMG designated the interest rate swaps as cash flow hedges. As a result, changes in the fair value of
NMG's swaps are recorded as a component of other comprehensive (loss) income. At August 2, 2008, we have $21.8 million of
unrecognized losses, net of tax, on our interest rate swap agreements included in accumulated other comprehensive (loss) income.
As a result of the swap agreements, NMG's effective fixed interest rates as to the $1,000.0 million in floating rate
indebtedness will currently range from 6.524% to 6.733% per quarter through 2010 and result in an average fixed rate of 6.608%.
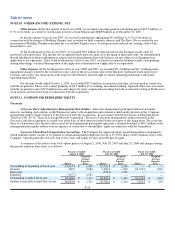
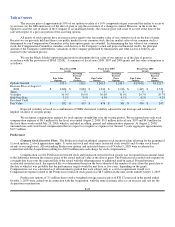
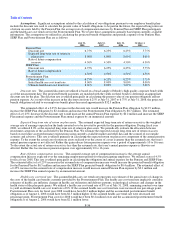
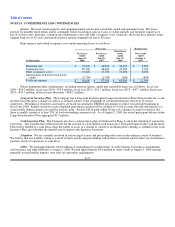
Interest expense. The significant components of interest expense are as follows:
(Successor)
(Predecessor)
(in thousands)
Fiscal year
ended
August 2,
2008
Fiscal year
ended
July 28,
2007
Forty-three
weeks ended
July 29,
2006
Nine weeks
ended
October 1,
2005
Asset-Based Revolving Credit Facility $ — $ — $ 1,332
$ —
Senior Secured Term Loan Facility 106,504 128,380 111,662
—
2028 Debentures 8,903 8,915 7,266
1,542
Senior Notes 63,000 63,000 51,421
—
Senior Subordinated Notes 51,875 51,875 42,339
—
2008 Notes — — 638
1,439
Amortization of debt issue costs 14,217 14,141 11,728
96
Other 3,275 3,689 111
205
Total interest expense 247,774 270,000 226,497
3,282
Less:
Interest income 4,933 7,370 5,386
3,046
Capitalized interest 3,036 2,825 3,446
1,146
Interest expense (income), net $ 239,805 $ 259,805 $ 217,665
$ (910)
F-27