Neiman Marcus 2007 Annual Report Download - page 132
Download and view the complete annual report
Please find page 132 of the 2007 Neiman Marcus annual report below. You can navigate through the pages in the report by either clicking on the pages listed below, or by using the keyword search tool below to find specific information within the annual report.-
 1
1 -
2
-
3
-
4
-
5
-
6
-
7
-
8
-
9
-
10
-
11
-
12
-
13
-
14
-
15
-
16
-
17
-
18
-
19
-
20
-
21
-
22
-
23
-
24
-
25
-
26
-
27
-
28
-
29
-
30
-
31
-
32
-
33
-
34
-
35
-
36
-
37
-
38
-
39
-
40
-
41
-
42
-
43
-
44
-
45
-
46
-
47
-
48
-
49
-
50
-
51
-
52
-
53
-
54
-
55
-
56
-
57
-
58
-
59
-
60
-
61
-
62
-
63
-
64
-
65
-
66
-
67
-
68
-
69
-
70
-
71
-
72
-
73
-
74
-
75
-
76
-
77
-
78
-
79
-
80
-
81
-
82
-
83
-
84
-
85
-
86
-
87
-
88
-
89
-
90
-
91
-
92
-
93
-
94
-
95
-
96
-
97
-
98
-
99
-
100
-
101
-
102
-
103
-
104
-
105
-
106
-
107
-
108
-
109
-
110
-
111
-
112
-
113
-
114
-
115
-
116
-
117
-
118
-
119
-
120
-
121
-
 122
122 -
 123
123 -
 124
124 -
 125
125 -
 126
126 -
 127
127 -
 128
128 -
 129
129 -
 130
130 -
 131
131 -
 132
132 -
 133
133 -
 134
134 -
 135
135 -
 136
136 -
 137
137 -
 138
138 -
 139
139 -
 140
140 -
 141
141 -
 142
142 -
143
-
144
-
145
-
146
-
147
-
148
-
149
-
150
-
151
-
152
-
153
-
154
-
155
-
156
-
157
-
158
-
159
-
160
-
161
-
162
-
163
-
164
-
165
-
166
-
167
-
168
-
169
-
170
-
171
-
172
-
173
-
174
-
175
-
176
-
177
-
178
-
179
-
180
-
181
-
182
-
183
-
184
-
185
-
186
-
187
-
188
-
189
-
190
-
191
-
192
-
193
-
194
-
195
-
196
-
197
-
198
-
199
-
200
-
201
-
202
-
203
-
204
-
205
-
206
 |
 |
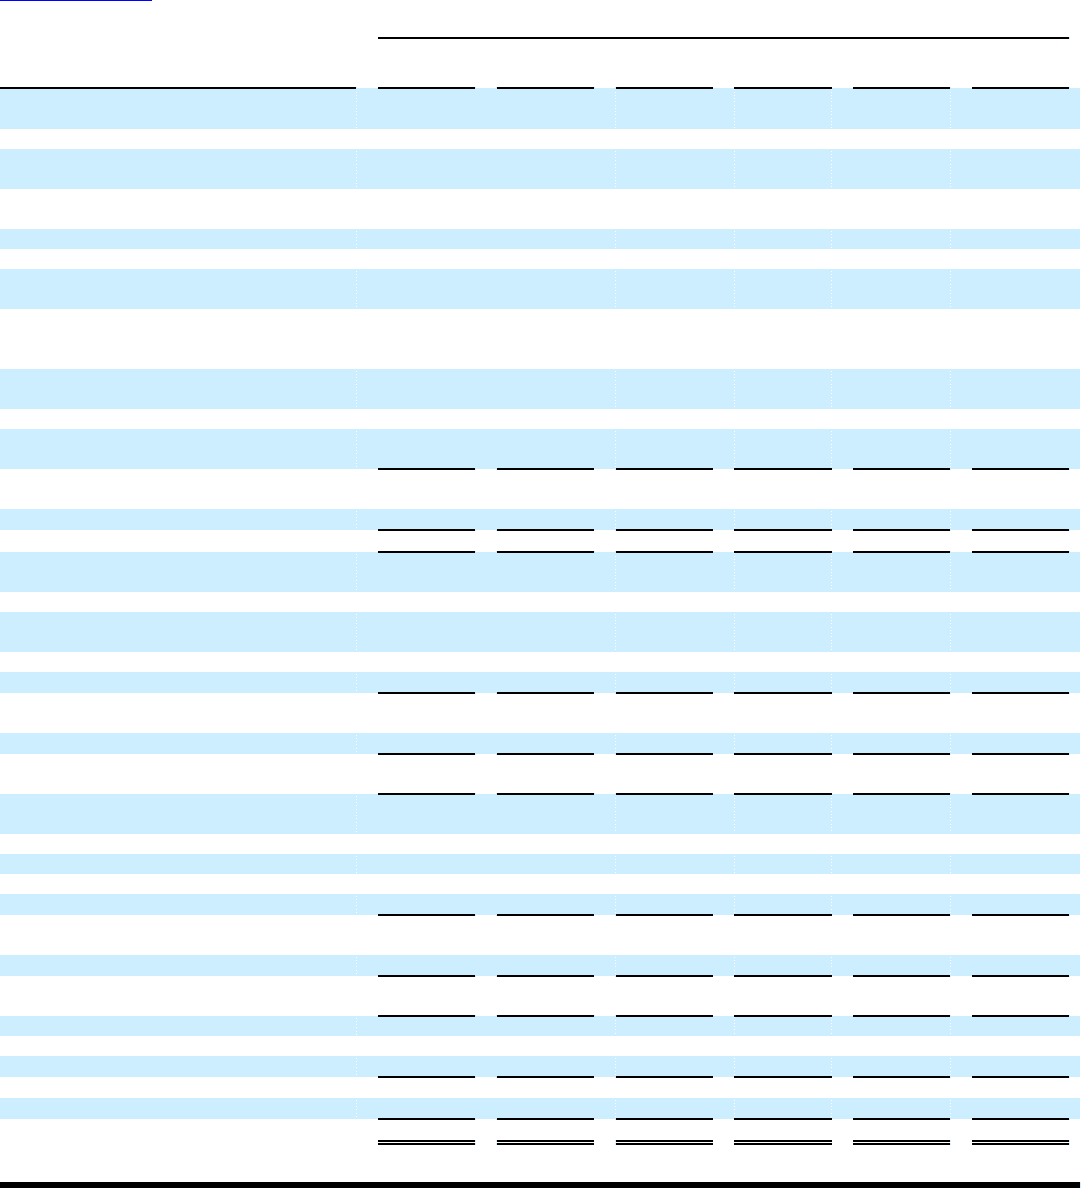
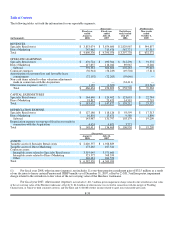
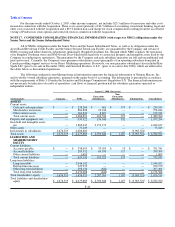
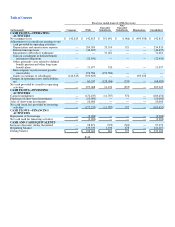
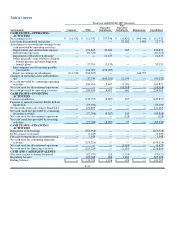
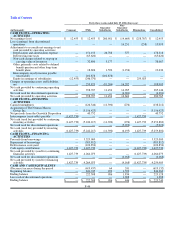
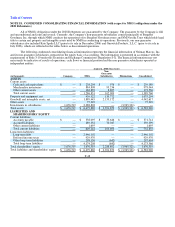
Table of Contents
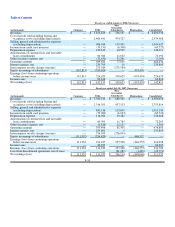
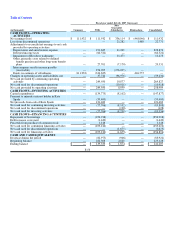
Forty-three weeks ended July 29, 2006 (Successor)
(in thousands) Company NMG
Guarantor
Subsidiaries
Non-
Guarantor
Subsidiaries Eliminations Consolidated
CASH FLOWS—OPERATING
ACTIVITIES
Net earnings (loss) $ 12,455 $ 12,455 $ 260,981 $ (14,669) $ (258,767) $ 12,455
Loss (earnings) from discontinued
operations — — — 14,251 (258) 13,993
Adjustments to reconcile net earnings to net
cash provided by operating activities:
Depreciation and amortization expense — 151,153 26,788 377 — 178,318
Deferred income taxes — (65,620) — — — (65,620)
Non-cash charges related to step-up in
carrying value of inventory — 32,890 5,177 — — 38,067
Other, primarily costs related to defined
benefit pension and other long-term
benefit plans — 18,696 1,590 (1,256) — 19,030
Intercompany royalty income payable
(receivable) — 201,878 (201,878) — — —
Equity in earnings of subsidiaries (12,455) (246,570) — — 259,025 —
Changes in operating assets and liabilities,
net — 253,825 (81,204)16,282 — 188,903
Net cash provided by continuing operating
activities — 358,707 11,454 14,985 — 385,146
Net cash used for discontinued operations — — — (4,381)— (4,381)
Net cash provided by operating activities — 358,707 11,454 10,604 — 380,765
CASH FLOWS—INVESTING
ACTIVITIES
Capital expenditures — (126,546) (11,390) (276) — (138,212)
Acquisition of The Neiman Marcus
Group, Inc. — (5,156,423) — — — (5,156,423)
Net proceeds from the Gurwitch Disposition — 40,752 — — — 40,752
Intercompany (receivable) payable (1,427,739)— — — 1,427,739 —
Net cash (used for) provided by continuing
investing activities (1,427,739) (5,242,217) (11,390) (276) 1,427,739 (5,253,883)
Net cash used for discontinued operations — — — (5,919)— (5,919)
Net cash (used for) provided by investing
activities (1,427,739)(5,242,217)(11,390)(6,195)1,427,739 (5,259,802)
CASH FLOWS—FINANCING
ACTIVITIES
Proceeds from borrowings — 3,325,000 — — — 3,325,000
Repayment of borrowings — (385,812) — — — (385,812)
Debt issuance costs paid — (102,854) — — — (102,854)
Cash equity contributions 1,427,739 1,427,739 — — (1,427,739)1,427,739
Net cash provided by (used for) continuing
financing activities 1,427,739 4,264,073 — — (1,427,739) 4,264,073
Net cash used for discontinued operations — — — (4,168)— (4,168)
Net cash provided by (used for) financing
activities 1,427,739 4,264,073 — (4,168)(1,427,739)4,259,905
CASH AND CASH EQUIVALENTS
(Decrease) increase during the period — (619,437) 64 241 — (619,132)
Beginning balance — 841,745 922 1,593 — 844,260
Ending balance — 222,308 986 1,834 — 225,128
Less cash of discontinued operations — — — 1,388 — 1,388
Ending balance $ — $ 222,308 $ 986 $ 446 $ — $ 223,740
F-46