Neiman Marcus 2007 Annual Report Download - page 31
Download and view the complete annual report
Please find page 31 of the 2007 Neiman Marcus annual report below. You can navigate through the pages in the report by either clicking on the pages listed below, or by using the keyword search tool below to find specific information within the annual report.-
 1
1 -
2
-
3
-
4
-
5
-
6
-
7
-
8
-
9
-
10
-
11
-
12
-
13
-
14
-
15
-
16
-
17
-
18
-
19
-
20
-
 21
21 -
 22
22 -
 23
23 -
 24
24 -
 25
25 -
 26
26 -
 27
27 -
 28
28 -
 29
29 -
 30
30 -
 31
31 -
 32
32 -
 33
33 -
 34
34 -
 35
35 -
 36
36 -
 37
37 -
 38
38 -
 39
39 -
 40
40 -
 41
41 -
42
-
43
-
44
-
45
-
46
-
47
-
48
-
49
-
50
-
51
-
52
-
53
-
54
-
55
-
56
-
57
-
58
-
59
-
60
-
61
-
62
-
63
-
64
-
65
-
66
-
67
-
68
-
69
-
70
-
71
-
72
-
73
-
74
-
75
-
76
-
77
-
78
-
79
-
80
-
81
-
82
-
83
-
84
-
85
-
86
-
87
-
88
-
89
-
90
-
91
-
92
-
93
-
94
-
95
-
96
-
97
-
98
-
99
-
100
-
101
-
102
-
103
-
104
-
105
-
106
-
107
-
108
-
109
-
110
-
111
-
112
-
113
-
114
-
115
-
116
-
117
-
118
-
119
-
120
-
121
-
122
-
123
-
124
-
125
-
126
-
127
-
128
-
129
-
130
-
131
-
132
-
133
-
134
-
135
-
136
-
137
-
138
-
139
-
140
-
141
-
142
-
143
-
144
-
145
-
146
-
147
-
148
-
149
-
150
-
151
-
152
-
153
-
154
-
155
-
156
-
157
-
158
-
159
-
160
-
161
-
162
-
163
-
164
-
165
-
166
-
167
-
168
-
169
-
170
-
171
-
172
-
173
-
174
-
175
-
176
-
177
-
178
-
179
-
180
-
181
-
182
-
183
-
184
-
185
-
186
-
187
-
188
-
189
-
190
-
191
-
192
-
193
-
194
-
195
-
196
-
197
-
198
-
199
-
200
-
201
-
202
-
203
-
204
-
205
-
206
 |
 |

Table of Contents
Fiscal Year 2008 Highlights
Fiscal year 2008 presented us with a challenging economic and retail environment. During the Fall season of fiscal year 2008,
we began to experience a lower level of customer spending. This weakness in consumer spending continued and deepened during the
remainder of fiscal year 2008. In response to the challenges associated with lower demand, we took actions to:
• stimulate sales through promotional and other events;
• reduce inventory purchases; and
• implement expense control initiatives.
With a slower retail environment, we grew our revenues by 4.8% and our pretax earnings by 4.4% over fiscal year 2007 despite
higher levels of markdowns required to sell inventories held in excess of demand. We believe the increase in revenues speaks to our
dedication to deliver distinctive and unique merchandise of the highest quality and fashion and provide excellent customer service at all
times, regardless of economic conditions.
Like many other retailers, we follow a 4-5-4 reporting calendar which resulted in an extra week in fiscal year 2008 (the 53rd
week).
Key highlights from fiscal year 2008 include:
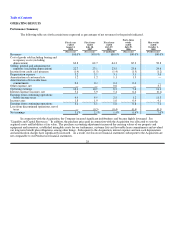
• Revenues—Our revenues for fiscal year 2008 were $4,600.5 million, an increase of 4.8% as compared to fiscal year 2007.
This increase was attributable to 1) increases in comparable revenues of 1.7%, 2) revenues from new stores, 3) higher
internet revenues and 4) sales generated in the 53rd week of $49.8 million.
Comparable revenues by quarter for fiscal year 2008 are as follows:
First fiscal quarter 6.5%
Second fiscal quarter 3.7%
Third fiscal quarter (2.5)%
Fourth fiscal quarter (1.4)%
Revenues in the 53rd week are not included in our comparable revenues calculations.
For Specialty Retail stores, our sales per square foot decreased to $634 for the 52 weeks ended July 26, 2008 from $638
for the 52 weeks ended July 28, 2007.
• Cost of goods sold including buying and occupancy costs (excluding depreciation)—COGS represented 63.8% of
revenues in fiscal year 2008 and 62.7% of revenues in fiscal year 2007. These increases in COGS were due primarily to
higher levels of markdowns incurred by our Specialty Retail stores due to a lower than anticipated level of demand.
• Selling, general and administrative expenses (excluding depreciation)—SG&A represented 22.7% of revenues in fiscal
year 2008 and 23.1% of revenues in fiscal year 2007. The decrease in SG&A as a percentage of revenues was primarily due
to lower estimated annual incentive compensation costs in fiscal year 2008, partially offset by increases in certain
components of SG&A (primarily benefits and insurance expense).
• Operating earnings—For fiscal year 2008, our operating earnings were $466.4 million, or 10.1% of revenues compared to
fiscal year 2007 operating earnings of $476.8 million, or 10.9% of revenues. Operating earnings margin decreased in fiscal
year 2008 by 0.8% of revenues primarily as a result of lower levels of full-price sales and higher net markdowns that
resulted in an increase in COGS by 1.1% of revenues, offset by a decrease in SG&A expenses by 0.4% of revenues.
• Pretax earnings—For fiscal year 2008, our pretax earnings were $226.6 million, or 4.9% of revenues, compared to fiscal
year 2007 pretax earnings of $217.0 million, or 4.9% of revenues. Pretax earnings for fiscal year 2008 benefited from lower
interest expense incurred as a result of both lower interest rates and debt levels. In addition, we estimate the 53rd week in
fiscal year 2008 generated approximately $3 million of pretax earnings.
27