Neiman Marcus 2007 Annual Report Download - page 135
Download and view the complete annual report
Please find page 135 of the 2007 Neiman Marcus annual report below. You can navigate through the pages in the report by either clicking on the pages listed below, or by using the keyword search tool below to find specific information within the annual report.-
 1
1 -
2
-
3
-
4
-
5
-
6
-
7
-
8
-
9
-
10
-
11
-
12
-
13
-
14
-
15
-
16
-
17
-
18
-
19
-
20
-
21
-
22
-
23
-
24
-
25
-
26
-
27
-
28
-
29
-
30
-
31
-
32
-
33
-
34
-
35
-
36
-
37
-
38
-
39
-
40
-
41
-
42
-
43
-
44
-
45
-
46
-
47
-
48
-
49
-
50
-
51
-
52
-
53
-
54
-
55
-
56
-
57
-
58
-
59
-
60
-
61
-
62
-
63
-
64
-
65
-
66
-
67
-
68
-
69
-
70
-
71
-
72
-
73
-
74
-
75
-
76
-
77
-
78
-
79
-
80
-
81
-
82
-
83
-
84
-
85
-
86
-
87
-
88
-
89
-
90
-
91
-
92
-
93
-
94
-
95
-
96
-
97
-
98
-
99
-
100
-
101
-
102
-
103
-
104
-
105
-
106
-
107
-
108
-
109
-
110
-
111
-
112
-
113
-
114
-
115
-
116
-
117
-
118
-
119
-
120
-
121
-
122
-
123
-
124
-
 125
125 -
 126
126 -
 127
127 -
 128
128 -
 129
129 -
 130
130 -
 131
131 -
 132
132 -
 133
133 -
 134
134 -
 135
135 -
 136
136 -
 137
137 -
 138
138 -
 139
139 -
 140
140 -
 141
141 -
 142
142 -
 143
143 -
 144
144 -
 145
145 -
146
-
147
-
148
-
149
-
150
-
151
-
152
-
153
-
154
-
155
-
156
-
157
-
158
-
159
-
160
-
161
-
162
-
163
-
164
-
165
-
166
-
167
-
168
-
169
-
170
-
171
-
172
-
173
-
174
-
175
-
176
-
177
-
178
-
179
-
180
-
181
-
182
-
183
-
184
-
185
-
186
-
187
-
188
-
189
-
190
-
191
-
192
-
193
-
194
-
195
-
196
-
197
-
198
-
199
-
200
-
201
-
202
-
203
-
204
-
205
-
206
 |
 |
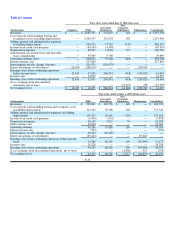
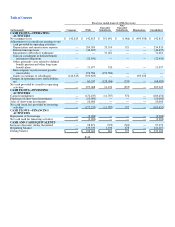
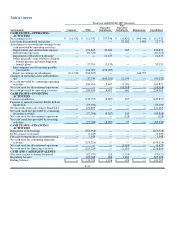
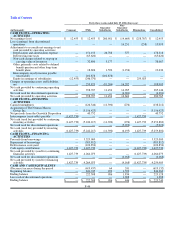
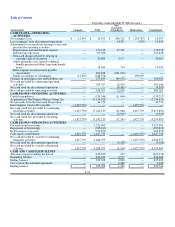
Table of Contents
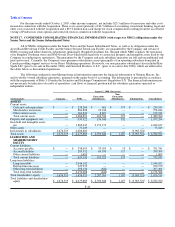
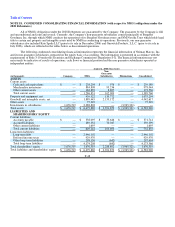
July 28, 2007 (Successor)
(in thousands) Company NMG
Non-
Guarantor
Subsidiaries Eliminations Consolidated
ASSETS
Current assets:
Cash and cash equivalents $ — $ 139,333 $ 1,874 $ — $ 141,207
Merchandise inventories — 821,749 96,520 — 918,269
Other current assets — 142,632 12,317 544 155,493
Total current assets — 1,103,714 110,711 544 1,214,969
Property and equipment, net — 901,072 142,639 — 1,043,711
Goodwill and intangible assets, net — 1,945,040 2,194,979 — 4,140,019
Other assets — 102,108 192 — 102,300
Investments in subsidiaries 1,558,012 2,333,438 — (3,891,450)—
Total assets $ 1,558,012 $ 6,385,372 $ 2,448,521 $ (3,890,906) $ 6,500,999
LIABILITIES AND SHAREHOLDERS'
EQUITY
Current liabilities:
Accounts payable $ — $ 318,439 $ 42,316 $ 544 $ 361,299
Accrued liabilities — 329,625 73,537 — 403,162
Other current liabilities — 3,426 — — 3,426
Total current liabilities — 651,490 115,853 544 767,887
Long-term liabilities:
Long-term debt — 2,945,906 — — 2,945,906
Deferred income taxes — 1,002,982 — — 1,002,982
Other long-term liabilities — 226,982 (770)— 226,212
Total long-term liabilities — 4,175,870 (770)— 4,175,100
Total shareholders' equity 1,558,012 1,558,012 2,333,438 (3,891,450)1,558,012
Total liabilities and shareholders' equity $ 1,558,012 $ 6,385,372 $ 2,448,521 $ (3,890,906)$ 6,500,999
F-49