Neiman Marcus 2007 Annual Report Download - page 115
Download and view the complete annual report
Please find page 115 of the 2007 Neiman Marcus annual report below. You can navigate through the pages in the report by either clicking on the pages listed below, or by using the keyword search tool below to find specific information within the annual report.-
 1
1 -
2
-
3
-
4
-
5
-
6
-
7
-
8
-
9
-
10
-
11
-
12
-
13
-
14
-
15
-
16
-
17
-
18
-
19
-
20
-
21
-
22
-
23
-
24
-
25
-
26
-
27
-
28
-
29
-
30
-
31
-
32
-
33
-
34
-
35
-
36
-
37
-
38
-
39
-
40
-
41
-
42
-
43
-
44
-
45
-
46
-
47
-
48
-
49
-
50
-
51
-
52
-
53
-
54
-
55
-
56
-
57
-
58
-
59
-
60
-
61
-
62
-
63
-
64
-
65
-
66
-
67
-
68
-
69
-
70
-
71
-
72
-
73
-
74
-
75
-
76
-
77
-
78
-
79
-
80
-
81
-
82
-
83
-
84
-
85
-
86
-
87
-
88
-
89
-
90
-
91
-
92
-
93
-
94
-
95
-
96
-
97
-
98
-
99
-
100
-
101
-
102
-
103
-
104
-
 105
105 -
 106
106 -
 107
107 -
 108
108 -
 109
109 -
 110
110 -
 111
111 -
 112
112 -
 113
113 -
 114
114 -
 115
115 -
 116
116 -
 117
117 -
 118
118 -
 119
119 -
 120
120 -
 121
121 -
 122
122 -
 123
123 -
 124
124 -
 125
125 -
126
-
127
-
128
-
129
-
130
-
131
-
132
-
133
-
134
-
135
-
136
-
137
-
138
-
139
-
140
-
141
-
142
-
143
-
144
-
145
-
146
-
147
-
148
-
149
-
150
-
151
-
152
-
153
-
154
-
155
-
156
-
157
-
158
-
159
-
160
-
161
-
162
-
163
-
164
-
165
-
166
-
167
-
168
-
169
-
170
-
171
-
172
-
173
-
174
-
175
-
176
-
177
-
178
-
179
-
180
-
181
-
182
-
183
-
184
-
185
-
186
-
187
-
188
-
189
-
190
-
191
-
192
-
193
-
194
-
195
-
196
-
197
-
198
-
199
-
200
-
201
-
202
-
203
-
204
-
205
-
206
 |
 |

Table of Contents
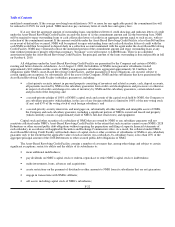
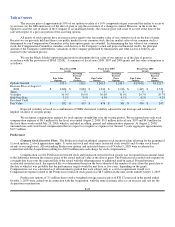
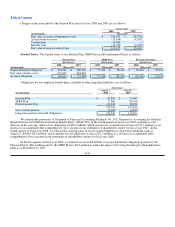
The exercise price of approximately 50% of our options escalate at a 10% compound rate per year until the earlier to occur of
(i) exercise, (ii) the fifth anniversary of the date of grant or (iii) the occurrence of a change in control. However, in the event the
Sponsors cause the sale of shares of the Company to an unaffiliated entity, the exercise price will cease to accrete at the time of the
sale with respect to a pro rata portion of the accreting options.
All grants of stock options have an exercise price equal to the fair market value of our common stock on the date of grant.
Because we are privately held and there is no public market for our common stock, the fair market value of our common stock is
determined by our Compensation Committee at the time option grants are awarded. In determining the fair value of our common
stock, the Compensation Committee considers such factors as the Company's actual and projected financial results, the principal
amount of the Company's indebtedness, valuations of the Company performed by third parties and other factors it believes are
material to the valuation process.
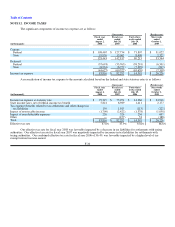
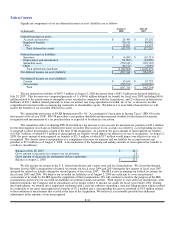
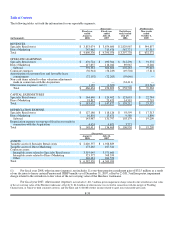
We use the Black-Scholes option-pricing model to determine the fair value of our options as of the date of grant in
accordance with the provisions of SFAS 123(R). A summary of fiscal years 2008, 2007 and 2006 grants and fair value assumptions is
as follows:
Fiscal Year 2008
Grants
Fiscal Year 2007
Grants
Fiscal Year 2006
Grants
Fair Value
Options
Accreting
Exercise
Price
Options
Fair Value
Options
Accreting
Exercise
Price
Options
Fair Value
Options
Accreting
Exercise
Price
Options
Options Granted 130.0 130.0 1,248.0 1,248.0 43,594.6 38,121.7
Exercise Price at August 2,
2008 $ 2,684 $ 2,684 $ 1,942 $ 2,136 $ 1,445 $ 1,749
Term 5 5 5 5 5 5
Volatility 30.0% 30.0% 30.0% 30.0% 29.7% 29.7%
Risk-Free Rate 3.5% 3.5% 4.5% 4.5% 4.2% 4.2%
Dividend Yield — — — — — —
Fair Value $ 882 $ 433 $ 676 $ 341 $ 494 $ 247
Expected volatility is based on a combination of NMG's historical volatility adjusted for our leverage and estimates of
implied volatility of our peer group.
We recognize compensation expense for stock options straight-line over the vesting period. We recognized non-cash stock
compensation expense of $6.1 million for the fiscal year ended August 2, 2008, $5.9 million in fiscal year 2007 and $4.0 million for
the forty-three weeks ended July 29, 2006, which is included in selling, general and administrative expenses. At August 2, 2008,
unearned non-cash stock-based compensation that we expect to recognize as expense over the next 5 years aggregates approximately
$12.7 million.
Predecessor
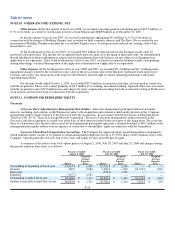
Common Stock Incentive Plans. The Predecessor had established common stock incentive plans allowing for the granting of
1) stock options, 2) stock appreciation rights, 3) restricted stock and stock units (restricted stock awards) and 4) other stock-based
awards to our employees. All outstanding Predecessor options and restricted shares as of October 5, 2005 were accelerated in
connection with the Acquisition resulting in a $19.0 million non-cash charge for stock compensation.
Compensation cost for Predecessor restricted stock and purchased restricted stock awards was recognized in an amount equal
to the difference between the exercise price of the award and fair value at the date of grant. The Predecessor recorded such expense on
a straight-line basis over the expected life of the award with the offsetting entry to additional paid-in capital. For performance
accelerated restricted stock, the expected life was determined based on the best estimate of the number of years from the grant date to
the date at which it was probable that the performance targets would be met (four or five years, depending on the grant).
Compensation cost was calculated as if all instruments granted that were subject only to a service requirement would vest.
Compensation expense related to the Predecessor restricted stock grants was $8.5 million in the nine-weeks ended October 1, 2005.
Predecessor options of 3.1 million shares with a weighted-average exercise price of $38.12 exercised in the period ended
October 1, 2005 were cashed out in connection with the Acquisition, with the same economic effect as an exercise and sale for the
Acquisition consideration.
F-29