Neiman Marcus 2007 Annual Report Download - page 34
Download and view the complete annual report
Please find page 34 of the 2007 Neiman Marcus annual report below. You can navigate through the pages in the report by either clicking on the pages listed below, or by using the keyword search tool below to find specific information within the annual report.-
 1
1 -
2
-
3
-
4
-
5
-
6
-
7
-
8
-
9
-
10
-
11
-
12
-
13
-
14
-
15
-
16
-
17
-
18
-
19
-
20
-
21
-
22
-
23
-
 24
24 -
 25
25 -
 26
26 -
 27
27 -
 28
28 -
 29
29 -
 30
30 -
 31
31 -
 32
32 -
 33
33 -
 34
34 -
 35
35 -
 36
36 -
 37
37 -
 38
38 -
 39
39 -
 40
40 -
 41
41 -
 42
42 -
 43
43 -
 44
44 -
45
-
46
-
47
-
48
-
49
-
50
-
51
-
52
-
53
-
54
-
55
-
56
-
57
-
58
-
59
-
60
-
61
-
62
-
63
-
64
-
65
-
66
-
67
-
68
-
69
-
70
-
71
-
72
-
73
-
74
-
75
-
76
-
77
-
78
-
79
-
80
-
81
-
82
-
83
-
84
-
85
-
86
-
87
-
88
-
89
-
90
-
91
-
92
-
93
-
94
-
95
-
96
-
97
-
98
-
99
-
100
-
101
-
102
-
103
-
104
-
105
-
106
-
107
-
108
-
109
-
110
-
111
-
112
-
113
-
114
-
115
-
116
-
117
-
118
-
119
-
120
-
121
-
122
-
123
-
124
-
125
-
126
-
127
-
128
-
129
-
130
-
131
-
132
-
133
-
134
-
135
-
136
-
137
-
138
-
139
-
140
-
141
-
142
-
143
-
144
-
145
-
146
-
147
-
148
-
149
-
150
-
151
-
152
-
153
-
154
-
155
-
156
-
157
-
158
-
159
-
160
-
161
-
162
-
163
-
164
-
165
-
166
-
167
-
168
-
169
-
170
-
171
-
172
-
173
-
174
-
175
-
176
-
177
-
178
-
179
-
180
-
181
-
182
-
183
-
184
-
185
-
186
-
187
-
188
-
189
-
190
-
191
-
192
-
193
-
194
-
195
-
196
-
197
-
198
-
199
-
200
-
201
-
202
-
203
-
204
-
205
-
206
 |
 |

Table of Contents
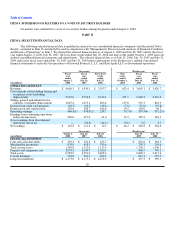
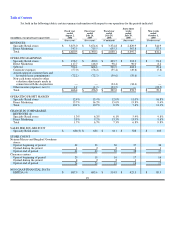
(1) For fiscal year 2008, other income (expense), net includes 1) a one-time pension curtailment gain of $32.5 million as a result
of our decision to freeze certain Pension and SERP benefits as of December 31, 2007, offset by 2) $31.3 million pretax impairment
charge related to the writedown to fair value of the net carrying value of the Horchow tradename.
For fiscal year 2007, other income (expense), net includes 1) $11.5 million pretax impairment charge related to the writedown to fair value
of the net carrying value of the Horchow tradename, offset by 2) $4.2 million of other income we received in connection with the merger of Wedding
Channel.com, in which we held a minority interest, and The Knot and 3) $6.0M of other income related to aged, non-escheatable gift cards.
For the nine weeks ended October 1, 2005, other income (expense), net includes $23.5 million of transaction and other costs
incurred in connection with the Acquisition. These costs consist primarily of $4.5 million of accounting, investment banking, legal and
other costs associated with the Acquisition and a $19.0 million non-cash charge for stock compensation resulting from the accelerated
vesting of Predecessor stock options and restricted stock in connection with the Acquisition.
(2) Comparable revenues include 1) revenues derived from our retail stores open for more than 52 weeks, including stores that
have been relocated or expanded and 2) revenues from our Direct Marketing operations. Comparable revenues exclude 1) revenues of
closed stores, 2) revenues from our discontinued operations (Gurwitch Products, L.L.C. and Kate Spade LLC) and 3) revenues of our
previous Chef's Catalog operations (sold in November 2004). The calculation of the change in comparable revenues for fiscal year
2008 is based on revenues for the 52 weeks ended July 26, 2008 compared to revenues for the 52 weeks ended July 28, 2007.
(3) Sales per square foot for fiscal year 2008 is based on revenues for the 52 weeks ended July 26, 2008.
(4) For an explanation of EBITDA, see "Management's Discussion and Analysis of Financial Condition and Results of
Operations — Non-GAAP Financial Measure-EBITDA."
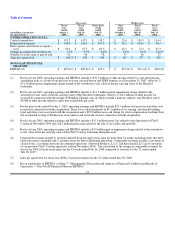
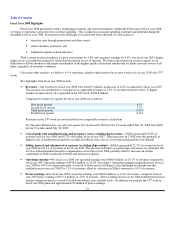
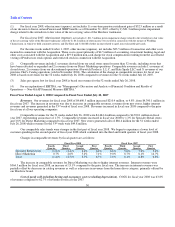
Fiscal Year Ended August 2, 2008 Compared to Fiscal Year Ended July 28, 2007
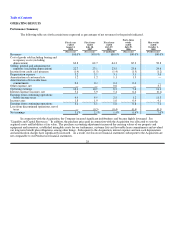
Revenues. Our revenues for fiscal year 2008 of $4,600.5 million increased $210.4 million, or 4.8%, from $4,390.1 million in
fiscal year 2007. The increase in revenues was due to increases in comparable revenues, revenues from new stores, higher internet
revenues and revenues generated in the 53rd week of fiscal year 2008. Revenues increased in fiscal year 2008 compared to the prior
fiscal year at all our operating companies.
Comparable revenues for the 52 weeks ended July 26, 2008 were $4,464.4 million compared to $4,390.1 million in fiscal
year 2007, representing an increase of 1.7%. Comparable revenues increased in fiscal year 2008 by 1.3% for Specialty Retail stores
and 3.8% for Direct Marketing compared to fiscal year 2007. New stores generated sales of $86.4 million for the 52 weeks ended
July 26, 2008 while revenues for the 53rd week were $49.8 million.
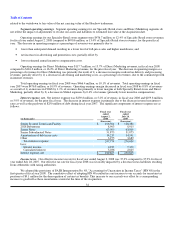
Our comparable sales trends were stronger in the first part of fiscal year 2008. We began to experience a lower level of
customer spending in the second quarter of fiscal year 2008 which continued into the third and fourth quarters of fiscal year 2008.
Changes in comparable revenues by fiscal quarter are as follows:
Fiscal Year 2008 Fiscal Year 2007
Fourth
Quarter
Third
Quarter
Second
Quarter
First
Quarter
Fourth
Quarter
Third
Quarter
Second
Quarter
First
Quarter
Specialty Retail stores (1.8)% (3.4)% 3.4% 6.4% 6.6% 5.6% 7.0% 5.4%
Direct Marketing 0.7% 2.0% 5.2% 7.1% 9.0% 8.7% 6.1% 14.7%
Total (1.4)% (2.5)% 3.7% 6.5% 7.0% 6.1% 6.8% 6.8%
The increase in comparable revenues for Direct Marketing was due to higher internet revenues. Internet revenues were
$564.5 million for fiscal year 2008, an increase of 13.1% compared to the prior fiscal year. The increase in internet revenues was
partially offset by decreases in catalog revenues as well as a decrease in revenues from the home décor category, primarily offered by
our Horchow brand.
Cost of goods sold including buying and occupancy costs (excluding depreciation). COGS for fiscal year 2008 was 63.8%
of revenues compared to 62.7% of revenues for fiscal year 2007.
30