Neiman Marcus 2007 Annual Report Download - page 32
Download and view the complete annual report
Please find page 32 of the 2007 Neiman Marcus annual report below. You can navigate through the pages in the report by either clicking on the pages listed below, or by using the keyword search tool below to find specific information within the annual report.-
 1
1 -
2
-
3
-
4
-
5
-
6
-
7
-
8
-
9
-
10
-
11
-
12
-
13
-
14
-
15
-
16
-
17
-
18
-
19
-
20
-
21
-
 22
22 -
 23
23 -
 24
24 -
 25
25 -
 26
26 -
 27
27 -
 28
28 -
 29
29 -
 30
30 -
 31
31 -
 32
32 -
 33
33 -
 34
34 -
 35
35 -
 36
36 -
 37
37 -
 38
38 -
 39
39 -
 40
40 -
 41
41 -
 42
42 -
43
-
44
-
45
-
46
-
47
-
48
-
49
-
50
-
51
-
52
-
53
-
54
-
55
-
56
-
57
-
58
-
59
-
60
-
61
-
62
-
63
-
64
-
65
-
66
-
67
-
68
-
69
-
70
-
71
-
72
-
73
-
74
-
75
-
76
-
77
-
78
-
79
-
80
-
81
-
82
-
83
-
84
-
85
-
86
-
87
-
88
-
89
-
90
-
91
-
92
-
93
-
94
-
95
-
96
-
97
-
98
-
99
-
100
-
101
-
102
-
103
-
104
-
105
-
106
-
107
-
108
-
109
-
110
-
111
-
112
-
113
-
114
-
115
-
116
-
117
-
118
-
119
-
120
-
121
-
122
-
123
-
124
-
125
-
126
-
127
-
128
-
129
-
130
-
131
-
132
-
133
-
134
-
135
-
136
-
137
-
138
-
139
-
140
-
141
-
142
-
143
-
144
-
145
-
146
-
147
-
148
-
149
-
150
-
151
-
152
-
153
-
154
-
155
-
156
-
157
-
158
-
159
-
160
-
161
-
162
-
163
-
164
-
165
-
166
-
167
-
168
-
169
-
170
-
171
-
172
-
173
-
174
-
175
-
176
-
177
-
178
-
179
-
180
-
181
-
182
-
183
-
184
-
185
-
186
-
187
-
188
-
189
-
190
-
191
-
192
-
193
-
194
-
195
-
196
-
197
-
198
-
199
-
200
-
201
-
202
-
203
-
204
-
205
-
206
 |
 |

Table of Contents
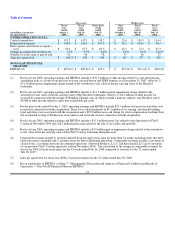
OPERATING RESULTS
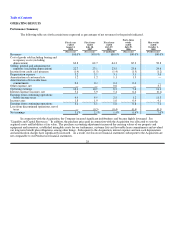
Performance Summary
The following table sets forth certain items expressed as percentages of net revenues for the periods indicated.
Fiscal year
ended
August 2,
2008
Fiscal year
ended
July 28,
2007
Fiscal year
ended
July 29,
2006
Forty-three
weeks
ended
July 29,
2006
Nine weeks
ended
October 1,
2005
(Successor) (Successor) (Combined) (Successor) (Predecessor)
Revenues 100.0% 100.0% 100.0% 100.0% 100.0%
Cost of goods sold including buying and
occupancy costs (excluding
depreciation) 63.8 62.7 64.3 65.3 58.8
Selling, general and administrative
expenses (excluding depreciation) 22.7 23.1 23.8 23.6 24.6
Income from credit card program (1.4) (1.5) (1.4) (1.5) (1.2)
Depreciation expense 3.2 3.1 3.1 3.1 3.0
Amortization of customer lists 1.2 1.2 1.1 1.3 —
Amortization of favorable lease
commitments 0.4 0.4 0.4 0.4 —
Other expense, net — — 0.6 — 3.7
Operating earnings 10.1 10.9 8.2 7.6 11.1
Interest expense (income), net 5.2 5.9 5.4 6.4 (0.1)
Earnings from continuing operations
before income taxes 4.9 4.9 2.8 1.2 11.3
Income taxes 1.8 1.9 1.0 0.4 4.1
Earnings from continuing operations 3.1 3.1 1.8 0.8 7.1
Loss from discontinued operations, net of
taxes — (0.5)(0.4)(0.4) (0.1)
Net earnings 3.1%2.5%1.4%0.4% 7.0%
In connection with the Acquisition, the Company incurred significant indebtedness and became highly leveraged. See
"Liquidity and Capital Resources." In addition, the purchase price paid in connection with the Acquisition was allocated to state the
acquired assets and liabilities at fair value. The purchase accounting adjustments increased the carrying values of our property and
equipment and inventory, established intangible assets for our tradenames, customer lists and favorable lease commitments and revalued
our long-term benefit plan obligations, among other things. Subsequent to the Acquisition, interest expense and non-cash depreciation
and amortization charges have significantly increased. As a result, our Successor financial statements subsequent to the Acquisition are
not comparable to our Predecessor financial statements.
28