Neiman Marcus 2007 Annual Report Download - page 129
Download and view the complete annual report
Please find page 129 of the 2007 Neiman Marcus annual report below. You can navigate through the pages in the report by either clicking on the pages listed below, or by using the keyword search tool below to find specific information within the annual report.-
 1
1 -
2
-
3
-
4
-
5
-
6
-
7
-
8
-
9
-
10
-
11
-
12
-
13
-
14
-
15
-
16
-
17
-
18
-
19
-
20
-
21
-
22
-
23
-
24
-
25
-
26
-
27
-
28
-
29
-
30
-
31
-
32
-
33
-
34
-
35
-
36
-
37
-
38
-
39
-
40
-
41
-
42
-
43
-
44
-
45
-
46
-
47
-
48
-
49
-
50
-
51
-
52
-
53
-
54
-
55
-
56
-
57
-
58
-
59
-
60
-
61
-
62
-
63
-
64
-
65
-
66
-
67
-
68
-
69
-
70
-
71
-
72
-
73
-
74
-
75
-
76
-
77
-
78
-
79
-
80
-
81
-
82
-
83
-
84
-
85
-
86
-
87
-
88
-
89
-
90
-
91
-
92
-
93
-
94
-
95
-
96
-
97
-
98
-
99
-
100
-
101
-
102
-
103
-
104
-
105
-
106
-
107
-
108
-
109
-
110
-
111
-
112
-
113
-
114
-
115
-
116
-
117
-
118
-
 119
119 -
 120
120 -
 121
121 -
 122
122 -
 123
123 -
 124
124 -
 125
125 -
 126
126 -
 127
127 -
 128
128 -
 129
129 -
 130
130 -
 131
131 -
 132
132 -
 133
133 -
 134
134 -
 135
135 -
 136
136 -
 137
137 -
 138
138 -
 139
139 -
140
-
141
-
142
-
143
-
144
-
145
-
146
-
147
-
148
-
149
-
150
-
151
-
152
-
153
-
154
-
155
-
156
-
157
-
158
-
159
-
160
-
161
-
162
-
163
-
164
-
165
-
166
-
167
-
168
-
169
-
170
-
171
-
172
-
173
-
174
-
175
-
176
-
177
-
178
-
179
-
180
-
181
-
182
-
183
-
184
-
185
-
186
-
187
-
188
-
189
-
190
-
191
-
192
-
193
-
194
-
195
-
196
-
197
-
198
-
199
-
200
-
201
-
202
-
203
-
204
-
205
-
206
 |
 |
Table of Contents
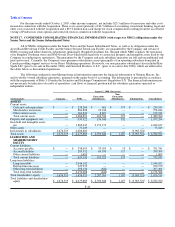
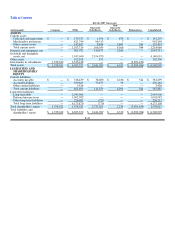
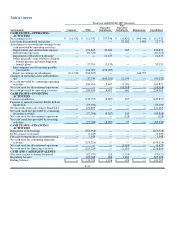
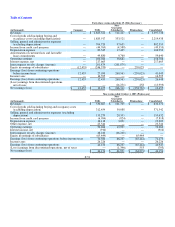
Forty-three weeks ended July 29, 2006 (Successor)
(in thousands) Company NMG
Guarantor
Subsidiaries
Non-
Guarantor
Subsidiaries Eliminations Consolidated
Revenues $ — $ 2,885,321 $ 512,007 $ 410 $ — $ 3,397,738
Cost of goods sold including buying and
occupancy costs (excluding depreciation) — 1,885,917 332,938 583 — 2,219,438
Selling, general and administrative expenses
(excluding depreciation) — 704,720 97,767 (132) — 802,355
Income from credit card program — (44,765) (4,588) — — (49,353)
Depreciation expense — 89,545 17,028 377 — 106,950
Amortization of customer lists and favorable
lease commitments — 49,880 9,760 — — 59,640
Operating earnings (loss) — 200,024 59,102 (418) — 258,708
Interest expense, net — 217,665 — — — 217,665
Intercompany royalty charges (income) — 201,879 (201,879) — — —
Equity in earnings of subsidiaries (12,455)(246,570)— — 259,025 —
Earnings (loss) from continuing operations
before income taxes 12,455 27,050 260,981 (418) (259,025) 41,043
Income taxes — 14,595 — — — 14,595
Earnings (loss) from continuing operations 12,455 12,455 260,981 (418) (259,025) 26,448
(Loss) earnings from discontinued
operations, net of taxes — — — (14,251)258 (13,993)
Net earnings (loss) $ 12,455 $ 12,455 $ 260,981 $ (14,669) $ (258,767) $ 12,455
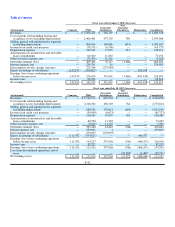
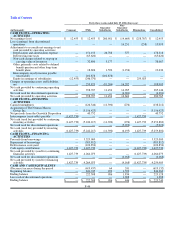
Nine weeks ended October 1, 2005 (Predecessor)
(in thousands) NMG
Guarantor
Subsidiaries
Non-
Guarantor
Subsidiaries Eliminations Consolidated
Revenues $ 530,667 $ 101,556 $ 149 $ — $ 632,372
Cost of goods sold including buying and occupancy costs
(excluding depreciation) 312,454 58,986 102 — 371,542
Selling, general and administrative expenses (excluding
depreciation) 135,279 20,491 (138) — 155,632
Income from credit card program (6,994) (824) — — (7,818)
Depreciation expense 16,118 3,015 76 — 19,209
Other expense, net 23,544 — — — 23,544
Operating earnings 50,266 19,888 109 — 70,263
Interest income, net (910) — — — (910)
Intercompany royalty charges (income) 46,240 (46,240) — — —
Equity in earnings of subsidiaries (65,444)— — 65,444 —
Earnings (loss) from continuing operations before income
taxes 70,380 66,128 109 (65,444) 71,173
Income taxes 26,226 — — — 26,226
Earnings (loss) from continuing operations 44,154 66,128 109 (65,444) 44,947
(Loss) earnings from discontinued operations, net of taxes — — (1,346)553 (793)
Net earnings (loss) $ 44,154 $ 66,128 $ (1,237)$ (64,891)$ 44,154
F-43