Neiman Marcus 2007 Annual Report Download - page 128
Download and view the complete annual report
Please find page 128 of the 2007 Neiman Marcus annual report below. You can navigate through the pages in the report by either clicking on the pages listed below, or by using the keyword search tool below to find specific information within the annual report.-
 1
1 -
2
-
3
-
4
-
5
-
6
-
7
-
8
-
9
-
10
-
11
-
12
-
13
-
14
-
15
-
16
-
17
-
18
-
19
-
20
-
21
-
22
-
23
-
24
-
25
-
26
-
27
-
28
-
29
-
30
-
31
-
32
-
33
-
34
-
35
-
36
-
37
-
38
-
39
-
40
-
41
-
42
-
43
-
44
-
45
-
46
-
47
-
48
-
49
-
50
-
51
-
52
-
53
-
54
-
55
-
56
-
57
-
58
-
59
-
60
-
61
-
62
-
63
-
64
-
65
-
66
-
67
-
68
-
69
-
70
-
71
-
72
-
73
-
74
-
75
-
76
-
77
-
78
-
79
-
80
-
81
-
82
-
83
-
84
-
85
-
86
-
87
-
88
-
89
-
90
-
91
-
92
-
93
-
94
-
95
-
96
-
97
-
98
-
99
-
100
-
101
-
102
-
103
-
104
-
105
-
106
-
107
-
108
-
109
-
110
-
111
-
112
-
113
-
114
-
115
-
116
-
117
-
 118
118 -
 119
119 -
 120
120 -
 121
121 -
 122
122 -
 123
123 -
 124
124 -
 125
125 -
 126
126 -
 127
127 -
 128
128 -
 129
129 -
 130
130 -
 131
131 -
 132
132 -
 133
133 -
 134
134 -
 135
135 -
 136
136 -
 137
137 -
 138
138 -
139
-
140
-
141
-
142
-
143
-
144
-
145
-
146
-
147
-
148
-
149
-
150
-
151
-
152
-
153
-
154
-
155
-
156
-
157
-
158
-
159
-
160
-
161
-
162
-
163
-
164
-
165
-
166
-
167
-
168
-
169
-
170
-
171
-
172
-
173
-
174
-
175
-
176
-
177
-
178
-
179
-
180
-
181
-
182
-
183
-
184
-
185
-
186
-
187
-
188
-
189
-
190
-
191
-
192
-
193
-
194
-
195
-
196
-
197
-
198
-
199
-
200
-
201
-
202
-
203
-
204
-
205
-
206
 |
 |
Table of Contents
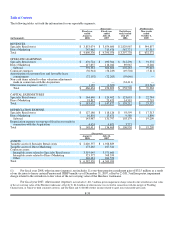
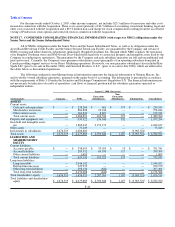
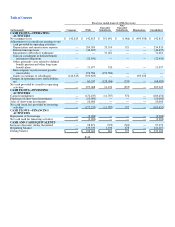
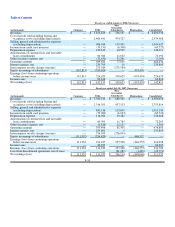
Fiscal year ended August 2, 2008 (Successor)
(in thousands) Company NMG
Guarantor
Subsidiaries
Non-
Guarantor
Subsidiaries Eliminations Consolidated
Revenues $ — $ 3,854,429 $ 746,107 $ — $ — $ 4,600,536
Cost of goods sold including buying and
occupancy costs (excluding depreciation) — 2,460,441 473,729 798 — 2,934,968
Selling, general and administrative expenses
(excluding depreciation) — 906,014 140,086 (653) — 1,045,447
Income from credit card program — (59,131) (6,596) — — (65,727)
Depreciation expense — 129,812 17,678 921 — 148,411
Amortization of customer lists and favorable
lease commitments — 60,360 11,832 — — 72,192
Other (income) expense, net — (32,450)31,261 — — (1,189)
Operating earnings (loss) — 389,383 78,117 (1,066) — 466,434
Interest expense, net — 239,795 10 — — 239,805
Intercompany royalty charges (income) — 273,584 (273,584) — — —
Equity in earnings of subsidiaries (142,813)(350,625)— — 493,438 —
Earnings (loss) from continuing operations
before income taxes 142,813 226,629 351,691 (1,066) (493,438) 226,629
Income taxes — 83,816 — — — 83,816
Net earnings (loss) $ 142,813 $ 142,813 $ 351,691 $ (1,066)$ (493,438)$ 142,813
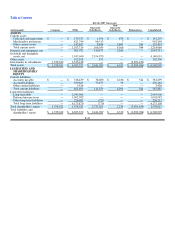
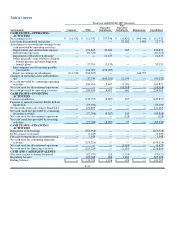
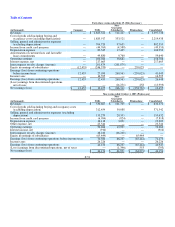
Fiscal year ended July 28, 2007 (Successor)
(in thousands) Company NMG
Guarantor
Subsidiaries
Non-
Guarantor
Subsidiaries Eliminations Consolidated
Revenues $ — $ 3,700,513 $ 689,563 $ — $ — $ 4,390,076
Cost of goods sold including buying and
occupancy costs (excluding depreciation) — 2,316,301 436,749 764 — 2,753,814
Selling, general and administrative expenses
(excluding depreciation) — 880,136 135,613 (609) — 1,015,140
Income from credit card program — (59,090) (6,633) — — (65,723)
Depreciation expense — 116,984 19,099 385 — 136,468
Amortization of customer lists and favorable
lease commitments — 60,500 11,765 — — 72,265
Other (income) expense, net — (9,816)11,125 — — 1,309
Operating earnings (loss) — 395,498 81,845 (540) — 476,803
Interest expense, net — 259,801 4 — — 259,805
Intercompany royalty charges (income) — 276,095 (276,095) — — —
Equity in earnings of subsidiaries (111,932)(334,625)— — 446,557 —
Earnings (loss) from continuing operations
before income taxes 111,932 194,227 357,936 (540) (446,557) 216,998
Income taxes — 82,295 — — — 82,295
Earnings (loss) from continuing operations 111,932 111,932 357,936 (540) (446,557) 134,703
Loss from discontinued operations, net of
taxes — — — (21,282)(1,489)(22,771)
Net earnings (loss) $ 111,932 $ 111,932 $ 357,936 $ (21,822) $ (448,046) $ 111,932
F-42