Neiman Marcus 2007 Annual Report Download - page 63
Download and view the complete annual report
Please find page 63 of the 2007 Neiman Marcus annual report below. You can navigate through the pages in the report by either clicking on the pages listed below, or by using the keyword search tool below to find specific information within the annual report.-
 1
1 -
2
-
3
-
4
-
5
-
6
-
7
-
8
-
9
-
10
-
11
-
12
-
13
-
14
-
15
-
16
-
17
-
18
-
19
-
20
-
21
-
22
-
23
-
24
-
25
-
26
-
27
-
28
-
29
-
30
-
31
-
32
-
33
-
34
-
35
-
36
-
37
-
38
-
39
-
40
-
41
-
42
-
43
-
44
-
45
-
46
-
47
-
48
-
49
-
50
-
51
-
52
-
 53
53 -
 54
54 -
 55
55 -
 56
56 -
 57
57 -
 58
58 -
 59
59 -
 60
60 -
 61
61 -
 62
62 -
 63
63 -
 64
64 -
 65
65 -
 66
66 -
 67
67 -
 68
68 -
 69
69 -
 70
70 -
 71
71 -
 72
72 -
 73
73 -
74
-
75
-
76
-
77
-
78
-
79
-
80
-
81
-
82
-
83
-
84
-
85
-
86
-
87
-
88
-
89
-
90
-
91
-
92
-
93
-
94
-
95
-
96
-
97
-
98
-
99
-
100
-
101
-
102
-
103
-
104
-
105
-
106
-
107
-
108
-
109
-
110
-
111
-
112
-
113
-
114
-
115
-
116
-
117
-
118
-
119
-
120
-
121
-
122
-
123
-
124
-
125
-
126
-
127
-
128
-
129
-
130
-
131
-
132
-
133
-
134
-
135
-
136
-
137
-
138
-
139
-
140
-
141
-
142
-
143
-
144
-
145
-
146
-
147
-
148
-
149
-
150
-
151
-
152
-
153
-
154
-
155
-
156
-
157
-
158
-
159
-
160
-
161
-
162
-
163
-
164
-
165
-
166
-
167
-
168
-
169
-
170
-
171
-
172
-
173
-
174
-
175
-
176
-
177
-
178
-
179
-
180
-
181
-
182
-
183
-
184
-
185
-
186
-
187
-
188
-
189
-
190
-
191
-
192
-
193
-
194
-
195
-
196
-
197
-
198
-
199
-
200
-
201
-
202
-
203
-
204
-
205
-
206
 |
 |

Table of Contents
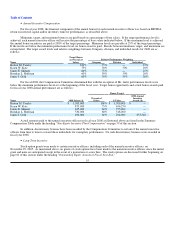
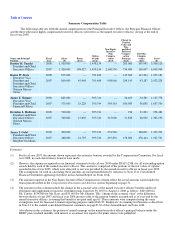
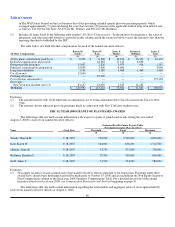
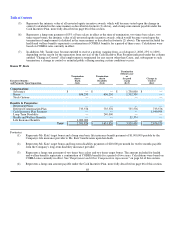
Summary Compensation Table
The following table sets forth the annual compensation for the Principal Executive Officer, the Principal Financial Officer,
and the three other most highly compensated executive officers (referred to as the named executive officers) serving at the end of
fiscal year 2008.
Name and Principal
Position
Fiscal
Year
Salary
($)
Bonus
($)(1)
Option
Awards
($)(2)
Non-Equity
Incentive
Plan
Compen-
sation
($)(3)
Change in
Pension
Value and
Non-
qualified
Deferred
Compen-
sation
Earnings
($)(4)
All Other
Compen-
sation
($)(5)
Total
($)
Burton M. Tansky 2008 1,500,000 — 1,458,134 — 205,000 145,992 3,309,126
President and Chief
Executive Officer 2007 1,420,000 108,027 1,458,134 2,160,530 754,000 138,657 6,039,348
Karen W. Katz 2008 875,000 — 791,488 — 145,369 113,324 1,925,181
Executive Vice
President and
President and Chief
Executive Officer
Neiman Marcus
Stores
2007 800,000 45,448 791,488 908,960 284,145 93,187 2,923,228
James E. Skinner 2008 625,000 — 395,744 — 54,653 52,381 1,127,778
Executive Vice
President and Chief
Financial Officer
2007 575,000 25,228 395,744 504,563 100,983 36,038 1,637,556
Brendan L. Hoffman 2008 530,000 — 395,744 — 914 31,823 958,481
President and Chief
Executive Officer
Neiman Marcus
Direct
2007 500,000 15,650 395,744 313,000 51,838 26,958 1,303,190
James J. Gold 2008 490,000 — 395,744 253,546 — 196,001 1,335,291
President and Chief
Executive Officer
Bergdorf Goodman
2007 460,000 21,793 395,744 435,850 158,000 476,144 1,947,531
Footnotes:
(1)
For fiscal year 2007, the amount shown represents discretionary bonuses awarded by the Compensation Committee. For fiscal
year 2008, no such discretionary bonuses were made.
(2)
Shown is the expense recognized in our financial statements for fiscal year 2008 under SFAS 123(R) for all outstanding option
awards held by each of the named executive officers. This amount is comprised of the portions of the fair values of options
awarded in fiscal year 2005, which were allocated to services provided by the named executive officers in fiscal year 2008.
The assumptions we used in calculating these amounts are incorporated herein by reference to Note 13 to Consolidated
Financial Statements appearing elsewhere in this Annual Report on Form 10-K.
(3)
The amounts reported in the Non-Equity Incentive Plan Compensation column reflect the actual amounts earned under the
bonus plan described in the Compensation Discussion and Analysis section beginning on page 51.
(4)
The amounts in this column include the change in the actuarial value of the named executive officers' benefits under our
retirement and supplemental executive retirement plans from July 30, 2007 to August 2, 2008 as follows: $205,000 for
Mr. Tansky; $134,000 for Ms. Katz; and $51,000 for Mr. Skinner. This "change in the actuarial value" is the difference
between the fiscal year 2007 and fiscal year 2008 present value of the pension benefits accumulated as of year-end by the
named executive officers, assuming that benefit is not paid until age 65. These amounts were computed using the same
assumptions used for financial statement reporting purposes under FAS 87, Employers' Accounting for Pensions as described
in Note 13 to the audited consolidated financial statements on page F-32 of this Annual Report on Form 10-K.
Also shown in this column is the portion of annual earnings on the named executive officer's principal balance under the
KEDC plan (credited monthly with interest at an annual rate equal to the prime interest rate published