Neiman Marcus 2007 Annual Report Download - page 200
Download and view the complete annual report
Please find page 200 of the 2007 Neiman Marcus annual report below. You can navigate through the pages in the report by either clicking on the pages listed below, or by using the keyword search tool below to find specific information within the annual report.-
 1
1 -
2
-
3
-
4
-
5
-
6
-
7
-
8
-
9
-
10
-
11
-
12
-
13
-
14
-
15
-
16
-
17
-
18
-
19
-
20
-
21
-
22
-
23
-
24
-
25
-
26
-
27
-
28
-
29
-
30
-
31
-
32
-
33
-
34
-
35
-
36
-
37
-
38
-
39
-
40
-
41
-
42
-
43
-
44
-
45
-
46
-
47
-
48
-
49
-
50
-
51
-
52
-
53
-
54
-
55
-
56
-
57
-
58
-
59
-
60
-
61
-
62
-
63
-
64
-
65
-
66
-
67
-
68
-
69
-
70
-
71
-
72
-
73
-
74
-
75
-
76
-
77
-
78
-
79
-
80
-
81
-
82
-
83
-
84
-
85
-
86
-
87
-
88
-
89
-
90
-
91
-
92
-
93
-
94
-
95
-
96
-
97
-
98
-
99
-
100
-
101
-
102
-
103
-
104
-
105
-
106
-
107
-
108
-
109
-
110
-
111
-
112
-
113
-
114
-
115
-
116
-
117
-
118
-
119
-
120
-
121
-
122
-
123
-
124
-
125
-
126
-
127
-
128
-
129
-
130
-
131
-
132
-
133
-
134
-
135
-
136
-
137
-
138
-
139
-
140
-
141
-
142
-
143
-
144
-
145
-
146
-
147
-
148
-
149
-
150
-
151
-
152
-
153
-
154
-
155
-
156
-
157
-
158
-
159
-
160
-
161
-
162
-
163
-
164
-
165
-
166
-
167
-
168
-
169
-
170
-
171
-
172
-
173
-
174
-
175
-
176
-
177
-
178
-
179
-
180
-
181
-
182
-
183
-
184
-
185
-
186
-
187
-
188
-
189
-
 190
190 -
 191
191 -
 192
192 -
 193
193 -
 194
194 -
 195
195 -
 196
196 -
 197
197 -
 198
198 -
 199
199 -
 200
200 -
 201
201 -
 202
202 -
 203
203 -
 204
204 -
 205
205 -
 206
206
 |
 |
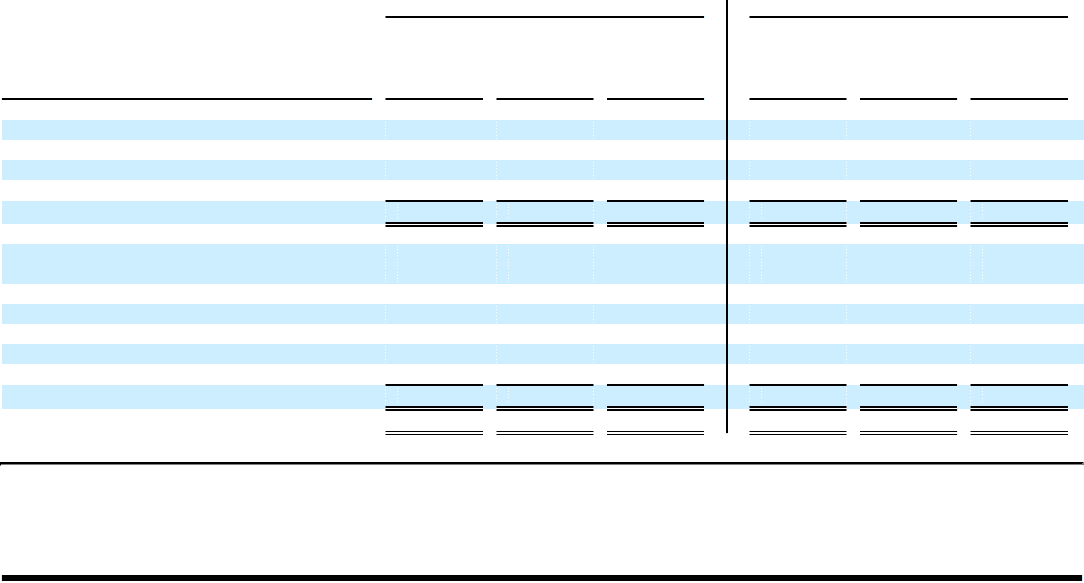
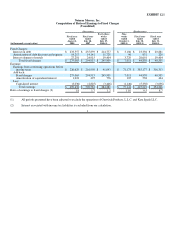
EXHIBIT 12.1
Neiman Marcus, Inc.
Computation of Ratio of Earnings to Fixed Charges
(Unaudited)
(Successor) (Predecessor)
(in thousands, except ratios)
Fiscal year
ended
August 2,
2008
Fiscal year
ended
July 28,
2007
Forty-three
weeks
ended
July 29,
2006(1)
Nine
weeks
ended
October 1,
2005(1)
Fiscal year
ended
July 30,
2005(1)
Fiscal year
ended
July 31,
2004(1)
Fixed Charges:
Interest on debt $ 233,557 $ 255,859 $ 214,777 $ 3,186 $ 23,336 $ 20,881
Amortization of debt discount and expense 14,217 14,141 11,728 96 831 220
Interest element of rentals 27,291 24,915 19,404 3,729 20,691 19,404
Total fixed charges $ 275,065 $ 294,915 $ 245,909 $ 7,011 $ 44,858 $ 40,505
Earnings:
Earnings from continuing operations before
income taxes $ 226,629 $ 216,998 $ 41,043 $ 71,173 $ 385,177 $ 316,313
Add back:
Fixed charges 275,065 294,915 245,909 7,011 44,858 40,505
Amortization of capitalized interest 1,018 495 776 105 538 424
Less:
Capitalized interest (3,036)(2,825)(3,446) (1,146)(5,350)(3,036)
Total earnings $ 499,676 $ 509,583 $ 284,282 $ 77,143 $ 425,223 $ 354,206
Ratio of earnings to fixed charges (2) 1.8 1.7 1.2 11.0 9.5 8.7
(1) All periods presented have been adjusted to exclude the operations of Gurwitch Products, L.L.C. and Kate Spade LLC.
(2) Interest associated with income tax liabilities is excluded from our calculation.
1