Neiman Marcus 2007 Annual Report Download - page 38
Download and view the complete annual report
Please find page 38 of the 2007 Neiman Marcus annual report below. You can navigate through the pages in the report by either clicking on the pages listed below, or by using the keyword search tool below to find specific information within the annual report.-
 1
1 -
2
-
3
-
4
-
5
-
6
-
7
-
8
-
9
-
10
-
11
-
12
-
13
-
14
-
15
-
16
-
17
-
18
-
19
-
20
-
21
-
22
-
23
-
24
-
25
-
26
-
27
-
 28
28 -
 29
29 -
 30
30 -
 31
31 -
 32
32 -
 33
33 -
 34
34 -
 35
35 -
 36
36 -
 37
37 -
 38
38 -
 39
39 -
 40
40 -
 41
41 -
 42
42 -
 43
43 -
 44
44 -
 45
45 -
 46
46 -
 47
47 -
 48
48 -
49
-
50
-
51
-
52
-
53
-
54
-
55
-
56
-
57
-
58
-
59
-
60
-
61
-
62
-
63
-
64
-
65
-
66
-
67
-
68
-
69
-
70
-
71
-
72
-
73
-
74
-
75
-
76
-
77
-
78
-
79
-
80
-
81
-
82
-
83
-
84
-
85
-
86
-
87
-
88
-
89
-
90
-
91
-
92
-
93
-
94
-
95
-
96
-
97
-
98
-
99
-
100
-
101
-
102
-
103
-
104
-
105
-
106
-
107
-
108
-
109
-
110
-
111
-
112
-
113
-
114
-
115
-
116
-
117
-
118
-
119
-
120
-
121
-
122
-
123
-
124
-
125
-
126
-
127
-
128
-
129
-
130
-
131
-
132
-
133
-
134
-
135
-
136
-
137
-
138
-
139
-
140
-
141
-
142
-
143
-
144
-
145
-
146
-
147
-
148
-
149
-
150
-
151
-
152
-
153
-
154
-
155
-
156
-
157
-
158
-
159
-
160
-
161
-
162
-
163
-
164
-
165
-
166
-
167
-
168
-
169
-
170
-
171
-
172
-
173
-
174
-
175
-
176
-
177
-
178
-
179
-
180
-
181
-
182
-
183
-
184
-
185
-
186
-
187
-
188
-
189
-
190
-
191
-
192
-
193
-
194
-
195
-
196
-
197
-
198
-
199
-
200
-
201
-
202
-
203
-
204
-
205
-
206
 |
 |

Table of Contents
carrying value of the acquired inventories recorded in connection with the Acquisition; and
• increased margins of approximately 0.6% of revenues primarily attributable to our Specialty Retail stores due primarily to
lower product costs, a decrease in net markdowns incurred in the Fall Season and a higher level of full-price sales in fiscal
year 2007.
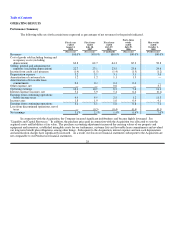
Selling, general and administrative expenses (excluding depreciation). SG&A expenses were 23.1% of revenues in fiscal
year 2007 compared to 23.8% of revenues in the prior fiscal year.
The net decrease in SG&A expenses as a percentage of revenues in fiscal year 2007 was primarily due to:
• a decrease in marketing and advertising costs of approximately 0.4% of revenues primarily due to 1) higher internet
sales by our Direct Marketing segment, which have a lower expense to revenue ratio than catalog sales and 2) a decrease
in costs incurred by our Specialty Retail stores;
• a decrease of approximately 0.4% of revenues in our payroll and employee benefit costs, primarily due to the leveraging
of these expenses on a higher level of revenues in fiscal year 2007 and favorable insurance claims experience; and
• a decrease in preopening expenses of approximately 0.1% of revenues.
These decreases in SG&A expenses, as a percentage of revenues, were partially offset by an increase in estimated annual
incentive compensation costs in fiscal year 2007 of approximately 0.2% of revenues.
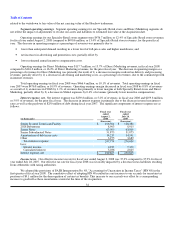
Income from credit card program. We received HSBC Program Income of $65.7 million, or 1.5% of revenues, in fiscal
year 2007 compared to $57.2 million, or 1.4% of revenues, in fiscal year 2006. HSBC Program Income increased as a percentage of
revenues in fiscal year 2007 compared to the prior fiscal year as a result of changes made to our credit card program in fiscal year
2006 related to, among other things, the interest rates applied to unpaid balances and the assessment of late fees.
Depreciation expense. Depreciation expense was $136.5 million, or 3.1% of revenues, in fiscal year 2007 compared to
$126.2 million, or 3.1% of revenues, in the prior fiscal year. The increase in depreciation expense was primarily due to new store
construction, store renovations and other capital spending in recent years.
Amortization expense. Amortization of acquisition related intangibles (customer lists and favorable lease commitments)
recorded as a result of the application of purchase accounting in connection with the Acquisition aggregated $72.3 million, or 1.6% of
revenues, for fiscal year 2007 and $59.6 million, or 1.5% of revenues, for fiscal year 2006. The increase in amortization expense in
fiscal year 2007 is due primarily to the fact that the Successor period in which amortization expense was recorded in fiscal year 2006
consisted of only forty-three weeks.
Other expense, net. In the first quarter of fiscal year 2007, we received consideration aggregating $4.2 million, or 0.1% of
revenues, in connection with the merger of Wedding Channel.com, in which we held a minority interest, and The Knot. We accounted
for our investment in Wedding Channel.com under the cost method. In prior years, we had previously reduced our carrying value of
this investment to zero.
In the fourth quarter of fiscal year 2007, we recorded $6.0 million of other income for the breakage on gift cards we
previously sold and issued. The income was recognized based upon our analysis of the aging of these gift cards, our determination
that the likelihood of future redemption is remote and our determination that such balances are not subject to escheatment laws
applicable to our operations. Prior to the fourth quarter of fiscal year 2007, we had not recognized breakage on gift cards pending,
among other things, our final determination of the applicable escheatment laws applicable to our operations.
In the fourth quarter of fiscal year 2007, we recorded a $11.5 million pretax impairment charge related to the writedown to
fair value of the net carrying value of the Horchow tradename based upon lower anticipated future revenues associated with the brand.
For the nine weeks ended October 1, 2005, other expense, net includes $23.5 million of transaction and other costs incurred
in connection with the Acquisition. These costs consist primarily of $4.5 million of accounting, investment banking, legal and other
costs associated with the Acquisition and a $19.0 million non-cash charge for stock compensation resulting from
34