Neiman Marcus 2007 Annual Report Download - page 133
Download and view the complete annual report
Please find page 133 of the 2007 Neiman Marcus annual report below. You can navigate through the pages in the report by either clicking on the pages listed below, or by using the keyword search tool below to find specific information within the annual report.-
 1
1 -
2
-
3
-
4
-
5
-
6
-
7
-
8
-
9
-
10
-
11
-
12
-
13
-
14
-
15
-
16
-
17
-
18
-
19
-
20
-
21
-
22
-
23
-
24
-
25
-
26
-
27
-
28
-
29
-
30
-
31
-
32
-
33
-
34
-
35
-
36
-
37
-
38
-
39
-
40
-
41
-
42
-
43
-
44
-
45
-
46
-
47
-
48
-
49
-
50
-
51
-
52
-
53
-
54
-
55
-
56
-
57
-
58
-
59
-
60
-
61
-
62
-
63
-
64
-
65
-
66
-
67
-
68
-
69
-
70
-
71
-
72
-
73
-
74
-
75
-
76
-
77
-
78
-
79
-
80
-
81
-
82
-
83
-
84
-
85
-
86
-
87
-
88
-
89
-
90
-
91
-
92
-
93
-
94
-
95
-
96
-
97
-
98
-
99
-
100
-
101
-
102
-
103
-
104
-
105
-
106
-
107
-
108
-
109
-
110
-
111
-
112
-
113
-
114
-
115
-
116
-
117
-
118
-
119
-
120
-
121
-
122
-
 123
123 -
 124
124 -
 125
125 -
 126
126 -
 127
127 -
 128
128 -
 129
129 -
 130
130 -
 131
131 -
 132
132 -
 133
133 -
 134
134 -
 135
135 -
 136
136 -
 137
137 -
 138
138 -
 139
139 -
 140
140 -
 141
141 -
 142
142 -
 143
143 -
144
-
145
-
146
-
147
-
148
-
149
-
150
-
151
-
152
-
153
-
154
-
155
-
156
-
157
-
158
-
159
-
160
-
161
-
162
-
163
-
164
-
165
-
166
-
167
-
168
-
169
-
170
-
171
-
172
-
173
-
174
-
175
-
176
-
177
-
178
-
179
-
180
-
181
-
182
-
183
-
184
-
185
-
186
-
187
-
188
-
189
-
190
-
191
-
192
-
193
-
194
-
195
-
196
-
197
-
198
-
199
-
200
-
201
-
202
-
203
-
204
-
205
-
206
 |
 |
Table of Contents
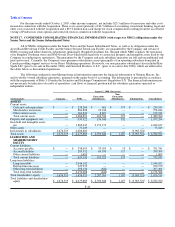
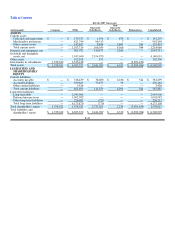
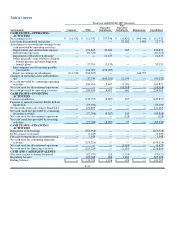
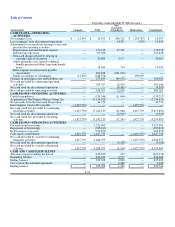
Nine weeks ended October 1, 2005 (Predecessor)
(in thousands) NMG
Guarantor
Subsidiaries
Non-Guarantor
Subsidiaries Eliminations Consolidated
CASH FLOWS—OPERATING
ACTIVITIES
Net earnings (loss) $ 44,154 $ 66,128 $ (1,237) $ (64,891) $ 44,154
Loss (earnings) from discontinued operations — — 1,346 (553) 793
Adjustments to reconcile net earnings to net
cash provided by operating activities:
Depreciation and amortization expense 16,214 3,015 76 — 19,305
Deferred income taxes (7,318) — — — (7,318)
Other, primarily costs related to defined
benefit pension and other long-term
benefit plans 14,997 254 493 — 15,744
Intercompany royalty income payable
(receivable) 46,240 (46,240) — — —
Equity in earnings of subsidiaries (65,444) — — 65,444 —
Changes in operating assets and liabilities,
net 505,357 (20,294)(534,208)— (49,145)
Net cash provided by (used for) continuing
operating activities 554,200 2,863 (533,530) — 23,533
Net cash used for discontinued operations — — (4,098)— (4,098)
Net cash provided by (used for) operating
activities 554,200 2,863 (537,628)— 19,435
CASH FLOWS—INVESTING
ACTIVITIES
Capital expenditures (22,455)(2,736)(384)— (25,575)
Net cash used for continuing investing
activities (22,455) (2,736) (384) — (25,575)
Net cash used for discontinued operations — — (736)— (736)
Net cash used for investing activities (22,455)(2,736)(1,120)— (26,311)
CASH FLOWS—FINANCING
ACTIVITIES
Cash dividends paid (7,346)— — — (7,346)
Net cash used for continuing financing
activities (7,346) — — — (7,346)
Net cash provided by discontinued operations — — 5,000 — 5,000
Net cash (used for) provided by financing
activities (7,346)— 5,000 — (2,346)
CASH AND CASH EQUIVALENTS
Increase (decrease) during the period 524,399 127 (533,748) — (9,222)
Beginning balance 317,346 795 535,341 — 853,482
Ending balance 841,745 922 1,593 — 844,260
Less cash of discontinued operations — — 1,056 — 1,056
Ending balance $ 841,745 $ 922 $ 537 $ — $ 843,204
F-47