Lexmark 2007 Annual Report Download - page 96
Download and view the complete annual report
Please find page 96 of the 2007 Lexmark annual report below. You can navigate through the pages in the report by either clicking on the pages listed below, or by using the keyword search tool below to find specific information within the annual report.-
 1
1 -
2
-
3
-
4
-
5
-
6
-
7
-
8
-
9
-
10
-
11
-
12
-
13
-
14
-
15
-
16
-
17
-
18
-
19
-
20
-
21
-
22
-
23
-
24
-
25
-
26
-
27
-
28
-
29
-
30
-
31
-
32
-
33
-
34
-
35
-
36
-
37
-
38
-
39
-
40
-
41
-
42
-
43
-
44
-
45
-
46
-
47
-
48
-
49
-
50
-
51
-
52
-
53
-
54
-
55
-
56
-
57
-
58
-
59
-
60
-
61
-
62
-
63
-
64
-
65
-
66
-
67
-
68
-
69
-
70
-
71
-
72
-
73
-
74
-
75
-
76
-
77
-
78
-
79
-
80
-
81
-
82
-
83
-
84
-
85
-
 86
86 -
 87
87 -
 88
88 -
 89
89 -
 90
90 -
 91
91 -
 92
92 -
 93
93 -
 94
94 -
 95
95 -
 96
96 -
 97
97 -
 98
98 -
 99
99 -
 100
100 -
 101
101 -
 102
102 -
 103
103 -
 104
104 -
 105
105 -
 106
106 -
107
-
108
-
109
-
110
-
111
-
112
-
113
 |
 |

17. SEGMENT DATA
Lexmark manufactures and sells a variety of printing and multifunction products and related supplies and
services and is primarily managed along Business and Consumer market segments. The Company
evaluates the performance of its segments based on revenue and operating income, and does not include
segment assets or other income and expense items for management reporting purposes. Segment
operating income (loss) includes: selling, general and administrative; research and development;
restructuring and other, net; and other expenses, certain of which are allocated to the respective
segments based on internal measures and may not be indicative of amounts that would be incurred
on a stand alone basis or may not be indicative of results of other enterprises in similar businesses. All
other operating income (loss) includes significant expenses that are managed outside of the reporting
segments. These unallocated costs include such items as information technology expenses, occupancy
costs, stock-based compensation and certain other corporate and regional general and administrative
expenses such as finance, legal and human resources.
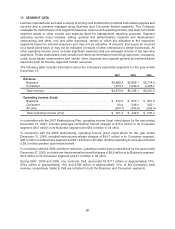
The following table includes information about the Company’s reportable segments for the year ended
December 31:
2007 2006 2005
Revenue:
Business . . . . . . . . . . . . . . . . . . . . . . . . . . . . . . . . . . . . . . . . . $2,999.2 $2,869.1 $2,774.8
Consumer . . . . . . . . . . . . . . . . . . . . . . . . . . . . . . . . . . . . . . . . 1,974.7 2,239.0 2,446.7
Total revenue . . . . . . . . . . . . . . . . . . . . . . . . . . . . . . . . . . . . . . $4,973.9 $5,108.1 $5,221.5
Operating income (loss):
Business . . . . . . . . . . . . . . . . . . . . . . . . . . . . . . . . . . . . . . . . . $ 612.0 $ 600.1 $ 661.0
Consumer . . . . . . . . . . . . . . . . . . . . . . . . . . . . . . . . . . . . . . . . 93.4 246.0 232.1
All other . . . . . . . . . . . . . . . . . . . . . . . . . . . . . . . . . . . . . . . . . . (384.1) (403.6) (359.4)
Total operating income (loss) . . . . . . . . . . . . . . . . . . . . . . . . . . $ 321.3 $ 442.5 $ 533.7
In connection with the 2007 Restructuring Plan, operating income (loss) noted above for the year ended
December 31, 2007, includes employee termination benefit charges of $13.9 million in its Consumer
segment, $6.5 million in its Business segment and $10.4 million in All other.
In connection with the 2006 restructuring, operating income (loss) noted above for the year ended
December 31, 2006, included restructuring-related charges of $54.7 million in its Consumer segment,
$35.2 million in its Business segment and $31.2 million in All other. All other operating income also included
a $9.9 million pension plan freeze benefit.
In connection with the 2005 workforce reduction, operating income (loss) noted above for the year ended
December 31, 2005, included one-time termination benefit charges of $6.5 million in its Business segment,
$2.6 million in its Consumer segment and $1.3 million in All other.
During 2007, 2006 and 2005, one customer, Dell, accounted for $717 million or approximately 14%,
$744 million or approximately 15% and $782 million or approximately 15%, of the Company’s total
revenue, respectively. Sales to Dell are included in both the Business and Consumer segments.
90