Lexmark 2007 Annual Report Download - page 89
Download and view the complete annual report
Please find page 89 of the 2007 Lexmark annual report below. You can navigate through the pages in the report by either clicking on the pages listed below, or by using the keyword search tool below to find specific information within the annual report.-
 1
1 -
2
-
3
-
4
-
5
-
6
-
7
-
8
-
9
-
10
-
11
-
12
-
13
-
14
-
15
-
16
-
17
-
18
-
19
-
20
-
21
-
22
-
23
-
24
-
25
-
26
-
27
-
28
-
29
-
30
-
31
-
32
-
33
-
34
-
35
-
36
-
37
-
38
-
39
-
40
-
41
-
42
-
43
-
44
-
45
-
46
-
47
-
48
-
49
-
50
-
51
-
52
-
53
-
54
-
55
-
56
-
57
-
58
-
59
-
60
-
61
-
62
-
63
-
64
-
65
-
66
-
67
-
68
-
69
-
70
-
71
-
72
-
73
-
74
-
75
-
76
-
77
-
78
-
 79
79 -
 80
80 -
 81
81 -
 82
82 -
 83
83 -
 84
84 -
 85
85 -
 86
86 -
 87
87 -
 88
88 -
 89
89 -
 90
90 -
 91
91 -
 92
92 -
 93
93 -
 94
94 -
 95
95 -
 96
96 -
 97
97 -
 98
98 -
 99
99 -
100
-
101
-
102
-
103
-
104
-
105
-
106
-
107
-
108
-
109
-
110
-
111
-
112
-
113
 |
 |

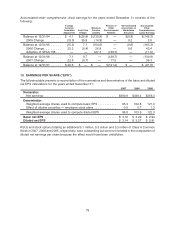
The estimated net loss for the defined benefit pension plans that will be amortized from Accumulated other
comprehensive earnings (loss) into net periodic benefit cost over the next fiscal year is $11 million. The
estimated prior service credit and net loss for the other defined benefit postretirement plans that will be
amortized from Accumulated other comprehensive earnings (loss) into net periodic benefit cost over the
next fiscal year are $4 million and $1 million, respectively.
Assumptions:
2007 2006 2007 2006
Pension
Benefits
Other
Postretire-
ment
Benefits
Weighted-Average Assumptions Used to Determine Benefit
Obligations at December 31:
Discount rate . . . . . . . . . . . . . . . . . . . . . . . . . . . . . . . . . . . . . . . . . . . 6.2% 5.7% 6.0% 5.7%
Rate of compensation increase . . . . . . . . . . . . . . . . . . . . . . . . . . . . . 3.5% 2.9% 4.0% 4.0%
2007 2006 2005 2007 2006 2005
Pension
Benefits
Other
Postretirement
Benefits
Weighted-Average Assumptions Used to Determine
Net Periodic Benefit Cost for Years Ended
December 31:
Discount rate . . . . . . . . . . . . . . . . . . . . . . . . . . . . . . . . 5.7% 5.5% 5.6% 5.7% 5.6% 5.8%
Expected long-term return on plan assets . . . . . . . . . . 7.6% 7.6% 7.7% — — —
Rate of compensation increase . . . . . . . . . . . . . . . . . . 2.9% 3.9% 3.9% 4.0% 4.0% 4.0%
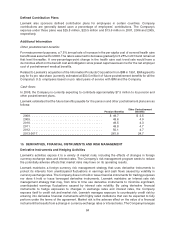
Plan assets:
Plan assets are invested in equity securities, government and agency securities, mortgage-backed
securities, corporate debt, annuity contracts and real estate investments. The U.S. defined benefit
plan comprises a significant portion of the assets and liabilities relating to the defined benefit plans.
The investment goal of the U.S. defined benefit plan is to achieve an adequate net investment return in
order to provide for future benefit payments to its participants. The target asset allocation percentages
approved by the compensation and pension committee of the Company’s board of directors are 75%
equity investments and 25% fixed income investments. The plan currently employs professional
investment managers to invest in two asset classes: U.S. equity and U.S. fixed income. Each
investment manager operates under an investment management contract that includes specific
investment guidelines, requiring among other actions, adequate diversification, prudent use of
derivatives and standard risk management practices such as portfolio constraints relating to
established benchmarks. The plan currently uses a combination of both active management and
passive index funds to achieve its investment goals.
Lexmark’s U.S. pension plan’s weighted-average asset allocations at December 31, 2007 and 2006, by
asset category were as follows:
2007 2006
Equity investments . . . . . . . . . . . . . . . . . . . . . . . . . . . . . . . . . . . . . . . . . . . . . . . . . . 75% 76%
Fixed income investments . . . . . . . . . . . . . . . . . . . . . . . . . . . . . . . . . . . . . . . . . . . . . 25% 24%
Total . . . . . . . . . . . . . . . . . . . . . . . . . . . . . . . . . . . . . . . . . . . . . . . . . . . . . . . . . . . . . 100% 100%
83