Lexmark 2007 Annual Report Download - page 85
Download and view the complete annual report
Please find page 85 of the 2007 Lexmark annual report below. You can navigate through the pages in the report by either clicking on the pages listed below, or by using the keyword search tool below to find specific information within the annual report.-
 1
1 -
2
-
3
-
4
-
5
-
6
-
7
-
8
-
9
-
10
-
11
-
12
-
13
-
14
-
15
-
16
-
17
-
18
-
19
-
20
-
21
-
22
-
23
-
24
-
25
-
26
-
27
-
28
-
29
-
30
-
31
-
32
-
33
-
34
-
35
-
36
-
37
-
38
-
39
-
40
-
41
-
42
-
43
-
44
-
45
-
46
-
47
-
48
-
49
-
50
-
51
-
52
-
53
-
54
-
55
-
56
-
57
-
58
-
59
-
60
-
61
-
62
-
63
-
64
-
65
-
66
-
67
-
68
-
69
-
70
-
71
-
72
-
73
-
74
-
 75
75 -
 76
76 -
 77
77 -
 78
78 -
 79
79 -
 80
80 -
 81
81 -
 82
82 -
 83
83 -
 84
84 -
 85
85 -
 86
86 -
 87
87 -
 88
88 -
 89
89 -
 90
90 -
 91
91 -
 92
92 -
 93
93 -
 94
94 -
 95
95 -
96
-
97
-
98
-
99
-
100
-
101
-
102
-
103
-
104
-
105
-
106
-
107
-
108
-
109
-
110
-
111
-
112
-
113
 |
 |

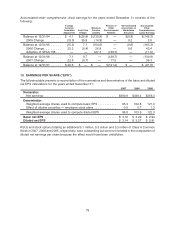
Accumulated other comprehensive (loss) earnings for the years ended December 31 consists of the
following:
Foreign
Currency
Translation
Adjustment
Cash Flow
Hedges
Minimum
Pension
Liability
Pension or
Other
Postretirement
Benefits
Net Unrealized
(Loss) Gain on
Marketable
Securities
Accumulated
Other
Comprehensive
(Loss) Earnings
Balance at 12/31/04 . . . . . . $ 4.1 $(28.8) $(139.8) $ — $(0.8) $(165.3)
2005 Change. . . . . . . . . . (19.3) 35.9 (14.8) — 0.2 2.0
Balance at 12/31/05 . . . . . . (15.2) 7.1 (154.6) — (0.6) (163.3)
2006 Change. . . . . . . . . . 22.3 (6.4) 26.9 — 0.6 43.4
Adoption of SFAS 158 . . . — — 127.7 (138.7) — (11.0)
Balance at 12/31/06 . . . . . . 7.1 0.7 — (138.7) — (130.9)
2007 Change. . . . . . . . . . 22.5 (0.7) — 17.5 — 39.3
Balance at 12/31/07 . . . . . . $ 29.6 $ — $ — $(121.2) $ — $ (91.6)
13. EARNINGS PER SHARE (“EPS”)
The following table presents a reconciliation of the numerators and denominators of the basic and diluted
net EPS calculations for the years ended December 31:
2007 2006 2005
Numerator:
Net earnings. . . . . . . . . . . . . . . . . . . . . . . . . . . . . . . . . . . . . . . . . . . $300.8 $338.4 $356.3
Denominator:
Weighted average shares used to compute basic EPS . . . . . . . . . . . 95.3 102.8 121.0
Effect of dilutive securities — employee stock plans . . . . . . . . . . . . . 0.5 0.7 1.3
Weighted average shares used to compute diluted EPS . . . . . . . . . . 95.8 103.5 122.3
Basic net EPS . . . . . . . . . . . . . . . . . . . . . . . . . . . . . . . . . . . . . . . . . . $ 3.16 $ 3.29 $ 2.94
Diluted net EPS . . . . . . . . . . . . . . . . . . . . . . . . . . . . . . . . . . . . . . . . . $ 3.14 $ 3.27 $ 2.91
RSUs and stock options totaling an additional 5.1 million, 5.3 million and 3.3 million of Class A Common
Stock in 2007, 2006 and 2005, respectively, were outstanding but were not included in the computation of
diluted net earnings per share because the effect would have been antidilutive.
79