Lexmark 2007 Annual Report Download - page 76
Download and view the complete annual report
Please find page 76 of the 2007 Lexmark annual report below. You can navigate through the pages in the report by either clicking on the pages listed below, or by using the keyword search tool below to find specific information within the annual report.-
 1
1 -
2
-
3
-
4
-
5
-
6
-
7
-
8
-
9
-
10
-
11
-
12
-
13
-
14
-
15
-
16
-
17
-
18
-
19
-
20
-
21
-
22
-
23
-
24
-
25
-
26
-
27
-
28
-
29
-
30
-
31
-
32
-
33
-
34
-
35
-
36
-
37
-
38
-
39
-
40
-
41
-
42
-
43
-
44
-
45
-
46
-
47
-
48
-
49
-
50
-
51
-
52
-
53
-
54
-
55
-
56
-
57
-
58
-
59
-
60
-
61
-
62
-
63
-
64
-
65
-
 66
66 -
 67
67 -
 68
68 -
 69
69 -
 70
70 -
 71
71 -
 72
72 -
 73
73 -
 74
74 -
 75
75 -
 76
76 -
 77
77 -
 78
78 -
 79
79 -
 80
80 -
 81
81 -
 82
82 -
 83
83 -
 84
84 -
 85
85 -
 86
86 -
87
-
88
-
89
-
90
-
91
-
92
-
93
-
94
-
95
-
96
-
97
-
98
-
99
-
100
-
101
-
102
-
103
-
104
-
105
-
106
-
107
-
108
-
109
-
110
-
111
-
112
-
113
 |
 |

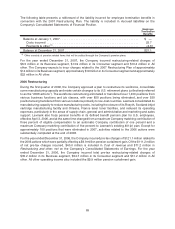
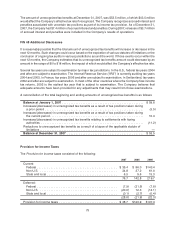
The following table illustrates the effect on net earnings and earnings per share if the Company had applied
the fair value recognition provisions of SFAS No. 123, Accounting for Stock-Based Compensation,to
stock-based employee compensation:
2005
Net earnings, as reported . . . . . . . . . . . . . . . . . . . . . . . . . . . . . . . . . . . . . . . . . . . . . . . . . $356.3
Deduct: Total stock-based employee compensation expense determined under fair value
based method for all awards, net of related tax effects . . . . . . . . . . . . . . . . . . . . . . . . . . . (52.3)
(1)
Pro forma net income . . . . . . . . . . . . . . . . . . . . . . . . . . . . . . . . . . . . . . . . . . . . . . . . . . . . $304.0
Net earnings per share:
Basic — as reported . . . . . . . . . . . . . . . . . . . . . . . . . . . . . . . . . . . . . . . . . . . . . . . . . . . . $ 2.94
Basic — pro forma . . . . . . . . . . . . . . . . . . . . . . . . . . . . . . . . . . . . . . . . . . . . . . . . . . . . . . 2.51
Diluted — as reported . . . . . . . . . . . . . . . . . . . . . . . . . . . . . . . . . . . . . . . . . . . . . . . . . . . $ 2.91
Diluted — pro forma . . . . . . . . . . . . . . . . . . . . . . . . . . . . . . . . . . . . . . . . . . . . . . . . . . . . . 2.48
(1)
2005 stock-based employee compensation expense includes the $25 million (pre-tax) impact of the acceleration of certain
unvested “out-of-the-money” stock options performed in December 2005.
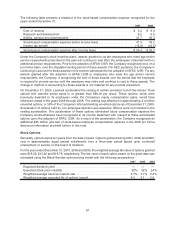
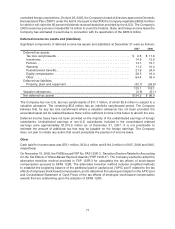
5. MARKETABLE SECURITIES
The Company evaluates its marketable securities in accordance with SFAS No. 115, Accounting for
Certain Investments in Debt and Equity Securities, and has determined that all of its investments in
marketable securities should be classified as available-for-sale and reported at fair value, with unrealized
gains and losses recorded in Accumulated other comprehensive earnings (loss). The fair values of the
Company’s available-for-sale marketable securities are based on quoted market prices or other
observable market data, or in some cases, the Company’s amortized cost, which approximates fair
value due to the frequent resetting of interest rates resulting in repricing of the investments.
As of December 31, 2007, the Company had gross unrealized losses and gross unrealized gains of
$1.5 million and $1.5 million, respectively, related to its marketable securities. Substantially all of the
unrealized losses as of December 31, 2007, have been in a loss position for less than 12 months. As of
December 31, 2006, the Company had immaterial gross unrealized losses related to its marketable
securities. The Company assesses its marketable securities for other-than-temporary declines in value by
considering various factors that include, among other things, any events that may affect the
creditworthiness of a security’s issuer, the length of time the security has been in a loss position, and
the Company’s ability and intent to hold the security until a forecasted recovery of fair value that may
include holding the security to maturity.
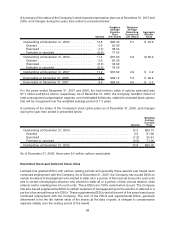
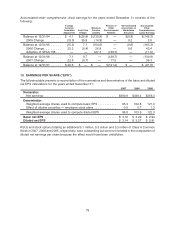
At December 31, 2007, the Company’s available-for-sale Marketable securities consisted of the following:
Amortized
Cost
Gross
Unrealized
Gains
Gross
Unrealized
Losses
Estimated
Fair Value
Municipal debt securities . . . . . . . . . . . . . . . . . . . . . $ 78.9 $ — $ — $ 78.9
Corporate debt securities . . . . . . . . . . . . . . . . . . . . . 147.6 0.1 (0.7) 147.0
U.S. gov’t and agency debt securities . . . . . . . . . . . 65.6 0.3 — 65.9
Asset-backed and mortgage-backed securities. . . . . 246.8 1.1 (0.8) 247.1
Total debt securities . . . . . . . . . . . . . . . . . . . . . . . . . 538.9 1.5 (1.5) 538.9
Preferred securities . . . . . . . . . . . . . . . . . . . . . . . . . 0.5 — — 0.5
Total security investments . . . . . . . . . . . . . . . . . . . . 539.4 1.5 (1.5) 539.4
Cash equivalents . . . . . . . . . . . . . . . . . . . . . . . . . . . (20.3) — — (20.3)
Total marketable securities. . . . . . . . . . . . . . . . . . . . $519.1 $1.5 $(1.5) $519.1
70