Lexmark 2007 Annual Report Download - page 43
Download and view the complete annual report
Please find page 43 of the 2007 Lexmark annual report below. You can navigate through the pages in the report by either clicking on the pages listed below, or by using the keyword search tool below to find specific information within the annual report.-
 1
1 -
2
-
3
-
4
-
5
-
6
-
7
-
8
-
9
-
10
-
11
-
12
-
13
-
14
-
15
-
16
-
17
-
18
-
19
-
20
-
21
-
22
-
23
-
24
-
25
-
26
-
27
-
28
-
29
-
30
-
31
-
32
-
 33
33 -
 34
34 -
 35
35 -
 36
36 -
 37
37 -
 38
38 -
 39
39 -
 40
40 -
 41
41 -
 42
42 -
 43
43 -
 44
44 -
 45
45 -
 46
46 -
 47
47 -
 48
48 -
 49
49 -
 50
50 -
 51
51 -
 52
52 -
 53
53 -
54
-
55
-
56
-
57
-
58
-
59
-
60
-
61
-
62
-
63
-
64
-
65
-
66
-
67
-
68
-
69
-
70
-
71
-
72
-
73
-
74
-
75
-
76
-
77
-
78
-
79
-
80
-
81
-
82
-
83
-
84
-
85
-
86
-
87
-
88
-
89
-
90
-
91
-
92
-
93
-
94
-
95
-
96
-
97
-
98
-
99
-
100
-
101
-
102
-
103
-
104
-
105
-
106
-
107
-
108
-
109
-
110
-
111
-
112
-
113
 |
 |

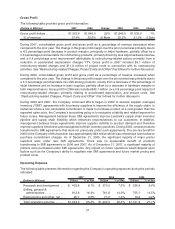
Gross Profit
The following table provides gross profit information:
(Dollars in Millions) 2007 2006 Change 2006 2005 Change
Gross profit dollars . . . . . . . . . . . . $1,563.6 $1,646.0 (5)% $1,646.0 $1,635.6 1%
% of revenue .............. 31.4% 32.2% (0.8)pts 32.2% 31.3% 0.9pts
During 2007, consolidated gross profit and gross profit as a percentage of revenue decreased when
compared to the prior year. The change in the gross profit margin over the prior period was primarily due to
a 4.2 percentage point decrease in product margins, principally in inkjet hardware, partially offset by a
3.0 percentage point favorable mix shift among products, primarily driven by less inkjet hardware revenue
and a 0.4 percentage point improvement attributable to restructuring-related actions primarily from a
reduction in accelerated depreciation charges YTY. Gross profit in 2007 included $5.1 million of
restructuring-related charges and $11.9 million of project costs in connection with its restructuring
activities. See “Restructuring-related Charges, Project Costs and Other” that follows for further discussion.
During 2006, consolidated gross profit and gross profit as a percentage of revenue increased when
compared to the prior year. The change in the gross profit margin over the prior period was primarily due to
a 3.3 percentage point favorable mix shift among products, mostly from a decrease in the percentage of
inkjet hardware and an increase in laser supplies, partially offset by a decrease in hardware margins in
both inkjet and lasers. Gross profit in 2006 also included $42.1 million (or a 0.8 percentage point impact) of
restructuring-related charges, primarily relating to accelerated depreciation, and project costs. See
“Restructuring-related Charges, Project Costs and Other” that follows for further discussion.
During 2006 and 2007, the Company continued efforts begun in 2002 to execute supplier managed
inventory (“SMI”) agreements with its primary suppliers to improve the efficiency of the supply chain. In
instances where a non-cancelable commitment is made to purchase product at a cost greater than the
expected sales price, the Company’s accounting policy is to recognize a liability and related expense for
future losses. Management believes these SMI agreements improve Lexmark’s supply chain inventory
pipeline and supply chain flexibility which enhances responsiveness to our customers. In addition,
management believes these agreements improve supplier visibility to product demand and therefore
improve suppliers’ timeliness and management of their inventory pipelines. During 2005, several products
transitioned to SMI agreements that were not previously under such agreements. The pre-tax benefit in
2005 to the Company of this transition was approximately $49 million which was reflected as lower adverse
purchase commitment charges. As of December 31, 2005, the significant majority of major printer
suppliers were under new SMI agreements. There was no measurable benefit of products
transitioning to SMI agreements in 2006 and 2007. As of December 31, 2007, a significant majority of
printers were purchased under SMI agreements. Any impact on future operations would depend upon
factors such as the Company’s ability to negotiate new SMI agreements and future market pricing and
product costs.
Operating Expense
The following table presents information regarding the Company’s operating expenses during the periods
indicated:
(Dollars in Millions) Dollars % of Rev Dollars % of Rev Dollars % of Rev
2007 2006 2005
Research and development . . . $ 403.8 8.1% $ 370.5 7.3% $ 336.4 6.4%
Selling, general &
administrative . . . . . . . . . . . . 812.8 16.4% 761.8 14.9% 755.1 14.5%
Restructuring and other, net . . . 25.7 0.5% 71.2 1.4% 10.4 0.2%
Total operating expense . . . . . . $1,242.3 25.0% $1,203.5 23.6% $1,101.9 21.1%
37